Enter your city or zip code below to get road, rail, and aviation noise for your city or home.
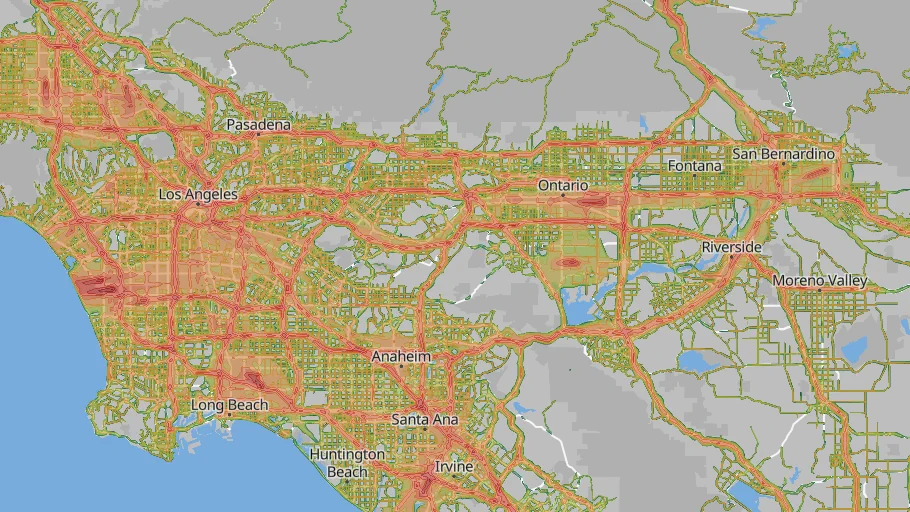
An example of our detailed noise maps from Los Angeles
Noise Data in a Nutshell
We are proud of what we built here, and pleased to offer it free of charge to help you find the best neighborhood for you.
We modeled traffic noise for every road in the United States. The model was calibrated against millions of real-world measurements, then applied to 6 million road segments nationwide. It uses 16 characteristics of each road (including traffic volume, speed, truck percentage, lane count, road classification, facility design, and pavement type) to predict source noise, then propagates that sound outward using physics-based distance decay. Where the government already has measured noise data for roads, aviation, and rail, those measurements take priority. Where it doesn't, our model fills the gap.
Why it matters: Noise is one of the things people overlook when moving to a new area. Those who don't check tend to regret it. While no neighborhood is immune to occasional disturbances, the frequency and intensity of transit noise varies enormously from one block to the next. Living near a busy road means less pleasant family BBQs, constant low-grade annoyance in the yard, and a less enjoyable evening on the patio.
Noise has also been linked to a number of physical and mental health complications.
- More deaths and heart disease: The WHO's 2018 Environmental Noise Guidelines for Europe estimate that long-term traffic noise costs at least 1.6 million healthy life years annually in Western Europe. A separate analysis attributed roughly 3% of coronary heart disease deaths in Europe (approximately 210,000 deaths per year) to chronic exposure. The cardiovascular threshold begins at just 50 dBA at night, the level of light traffic heard through a closed window. (Munzel et al., Circulation Research, 2024; Schmidt, Environmental Health Perspectives)
- Higher Type 2 diabetes risk: In a Danish cohort of 57,053 adults followed for approximately 10 years, every 10 dB increase in residential road-traffic noise was linked to an 8 to 11% higher risk of type 2 diabetes, independent of BMI, diet, exercise, and air pollution. The UK Biobank cohort (305,969 participants) replicated the effect. The proposed mechanism is sleep fragmentation and elevated stress hormones. (Sorensen et al., Environmental Health Perspectives, 2013; Cai et al., UK Biobank, 2022)
- Delayed learning in children: The RANCH project studied 2,844 children at 89 schools near airports in the UK, Netherlands, and Spain. It found that each 5 dB increase in aircraft noise corresponded to roughly a 2-month delay in reading comprehension in UK children, plus measurable deficits in recognition memory. Effects persisted after adjusting for socioeconomic status and classroom insulation. (Stansfeld et al., The Lancet, 2005)
- Higher depression risk: A 5-year prospective study found that residents exposed to 24-hour road-traffic noise above 55 dBA had a 29% higher incidence of depressive symptoms versus those below 55 dBA. A 2020 meta-analysis of 31 studies found aircraft noise specifically raised depression risk by 12% per 10 dB, with effects starting in the 45 to 50 dB range. (Hegewald et al., Int. J. Environ. Res. Public Health, 2020; Lin et al., Frontiers in Public Health, 2023)
- Higher cholesterol: A 2026 study of approximately 272,000 European adults found that nighttime road-traffic noise above 50 dB was associated with adverse cholesterol and lipid biomarker changes, with consistent effects appearing around 50 dB and strengthening above 55 dB. A separate randomized exposure trial showed that simulated traffic noise peaking at 60 dB during sleep caused measurable endothelial dysfunction in healthy young adults after just a few nights. (Hahad et al., European Society of Cardiology, 2026)
- Higher Alzheimer's and dementia risk: A nationwide Danish study found a threshold-style association between long-term road-traffic noise and dementia incidence, with risk rising up to around 65 dB before plateauing. A substantial portion of the dose-response curve sits inside ordinary urban exposure ranges, which you can see on our maps. The WHO recommends keeping road noise below 53 dB daytime and 45 dB at night to prevent these outcomes. For reference, normal conversation is around 60 dB and motorway traffic is around 70 dB. (Tuffier et al., Alzheimer's & Dementia, 2024; WHO Environmental Noise Guidelines, 2018)
There are more studies we could cite, but this page is not a health summit. The point is that noise is a serious health concern and much more serious than most buyers and renters realize.
The problem is that no public tool was doing a good job of showing where traffic noise actually exists in relation to homes and neighborhoods. The Department of Transportation has a national noise map, and it is quite good. We used it as both a calibration source and a gap-fill layer. But it only covers roads the government chose to measure or model, misses many smaller airports, and does not aggregate to a neighborhood or address level. We filled those gaps and made the map much easier to use.
Methodology
The noise model is built on multiple reliable sources, resulting in data that is superior to source data. The model is built entirely on public data from federal agencies. Every input is traceable to an authoritative government source. BestNeighborhood has permission to use these data sources as indicated.
- Highway Performance Monitoring System (HPMS), Federal Highway Administration. This is the backbone of the model. It contains every road in all 50 states along with the characteristics that determine how loud each one is: daily traffic counts, posted speed, percentage of heavy trucks, number of lanes, functional classification (interstate, arterial, collector, local), whether the road is one-way, and pavement surface type.
- National Transportation Noise Map, Bureau of Transportation Statistics, U.S. Department of Transportation. The government's own noise measurements at 30-meter resolution for road, aviation, and rail corridors nationwide (2020 data). We use this as the ground truth to calibrate and validate our model, as a direct overlay for aviation and rail noise on the map, and as a gap-fill layer: wherever the government's measurements exceed our predictions, their values replace ours.
- Terminal Area Forecast and Runway Data, Federal Aviation Administration. Annual flight operations, based aircraft counts, and runway geometry for U.S. airports. We use these to predict noise footprints for smaller airports that the government's aviation data ignores.
- National Land Cover Database, U.S. Geological Survey / Multi-Resolution Land Characteristics Consortium. Three satellite-derived datasets at 30-meter resolution:
- Land Cover Classification (NLCD 2021) identifies what type of terrain surrounds each road: developed land, forest, grassland, cropland, water, etc. Different surfaces absorb and reflect sound differently.
- Impervious Surface (NLCD 2021) measures the percentage of hard surfaces (pavement, buildings, rooftops) per 30-meter pixel. Hard surfaces reflect sound and let it travel farther.
- Tree Canopy Cover (USDA Forest Service, distributed via MRLC) measures vegetation density. Trees absorb and scatter sound waves, reducing how far noise travels.
- EPA Outdoor Noise Threshold. The U.S. Environmental Protection Agency's 1974 “Levels Document” identifies 55 dBA as the level above which outdoor activity interference and health effects begin. We use this as a key reporting threshold: for every block in the country, we calculate what percentage of its area exceeds this level.
If you don't care about the details, you can simply take this all to mean we're not messing around.
How We Predict Road Noise
We sampled nearly one million road segments from four geographically diverse states (Rhode Island, Texas, Florida, and California) and compared what our model predicted against what the Department of Transportation actually measured at each location. The training set spans urban interstates, suburban arterials, rural highways, desert roads, and coastal routes.
The model looks at 16 characteristics of each road to predict how loud it is. The most important ones, in order of influence:
- Road classification is the single biggest factor. The difference between an interstate and a quiet collector road can be up to 11 dBA purely from classification alone, because road class is a proxy for dozens of design decisions: grade separation, speed, lane width, access control, and traffic composition. We classify each road into one of seven functional categories (Interstate, Freeway, Principal Arterial, Minor Arterial, Major Collector, Minor Collector, and Local) so the model can account for these differences.
- Traffic volume. Every tenfold increase in daily traffic (say, from 5,000 to 50,000 vehicles) adds approximately 4.5 dBA.
- One-way vs. two-way. A one-way road is about 5 dBA louder than a two-way road carrying comparable total traffic, because all vehicles pass on the same side.
- Lane count. Going from 2 to 4 lanes adds roughly 1.8 dBA.
- Truck percentage. A road with 20% heavy trucks is about 1.2 dBA louder than one with no trucks.
- Speed. Surprisingly small once road class is accounted for. Doubling speed adds only about 0.5 dBA, because most of the “fast roads are loud” effect is already captured by road classification.
- Pavement type. Minor acoustic effect, but roads with documented surface types are systematically louder because they tend to be higher-class, better-monitored roads.
How Accurate Is It
The map's accuracy is extremely high because it intelligently incorporates real-world data and modeled data. The model alone has an R-squared value of 0.68 against Department of Transportation ground-truth measurements. That means our formula can predict about 68% of the real-world variation in road noise using only the road characteristics listed above. For a model of something as physically complex as how sound travels through varied terrain, weather, traffic flow, and built environment, that is a strong result.
We also tested whether a more sophisticated machine-learning approach could do better. A gradient-boosted tree model (the kind used by major tech companies for prediction tasks) topped out at R-squared = 0.75. Our simpler formula captures 91% of what is learnable from this data. The remaining gap is a mix of things no model can predict from road characteristics: the exact traffic mix at the time of measurement, weather conditions, whether a sound wall was recently installed, or whether the road was under construction.
The typical prediction error (RMSE) is 5.5 dBA. To put that in perspective: 3 dBA is the smallest difference most people can perceive. For interstates and freeways, where traffic data is most reliable, the error drops to 4.7 dBA. For local roads, where state-reported data is spottier, it rises to about 8 dBA.
The model has near-zero average bias across every road class. It does not systematically over-predict or under-predict. It is well-calibrated.
The effective accuracy of the final map is substantially higher than R-squared = 0.68. That figure measures the road model in isolation. The published map adds several layers that close the remaining gap:
- Wherever the Department of Transportation's own measurements are louder than our prediction, their values replace ours. For major roads the government covers, the map is effectively as accurate as the government's own model.
- Aviation and rail noise are overlaid directly from government measurements, not predicted by our formula.
- At complex interchanges where multiple roads overlap, the model combines their noise in the energy domain (the physically correct way), which fixes a source of under-prediction that affects models scoring roads individually.
In practice: if you are looking at a major highway, the noise on this map is almost certainly the government's own data. Our formula primarily governs accuracy for minor roads, local streets, and segments the government did not choose to model.
How Sound Fades with Distance
We couldn't just stop with how loud a road is. What you care about is how loud it is when it reaches you. Predicting how loud a road is at the source is only half the problem. The other half is knowing how far that noise reaches into surrounding neighborhoods.
Sound fades with distance following a well-understood physics relationship (logarithmic decay). The key variable is how quickly it fades, which depends on terrain. Dense forests absorb sound faster. Open pavement and water let it travel farther. We calibrate the decay rate to sit at a midpoint tuned for developed areas where most people live.
Some practical examples of what this means on the map:
- A major interstate (80 dBA at the road) fades to about 59 dBA at 100 meters, 48 dBA at 300 meters, and drops below audibility (35 dBA) about 950 meters from the centerline. That is roughly half a mile.
- A typical arterial road (65 dBA) drops below audibility within about 280 meters.
- A quieter collector road (55 dBA) is only audible within about 95 meters, or roughly one football field.
We also built a more advanced version that uses satellite imagery to adjust the decay rate based on the actual terrain between the road and each point on the map: tree canopy, pavement density, and land cover type all factor in. Dense tree cover makes noise fade faster. Large parking lots and open water let it travel farther. The advanced model is available as an option, though the production map currently uses the calibrated midpoint for processing speed and consistency across all 50 states.
Government Data Overlays
After our road model runs, we overlay three layers of government data that are not modeled, just directly applied:
- DoT road gap-fill. Wherever the government's road noise measurements exceed what our model predicted, the government's value replaces ours. This catches roads we under-predicted, roads with missing data in HPMS, and road segments the government models that we do not. No double-counting: our value is removed before the government's is inserted.
- Aviation noise of major airports. Airport noise zones from the Department of Transportation's aviation rasters are overlaid directly. These are government measurements, not modeled by us.
- Rail noise. Freight lines, commuter rail, and Amtrak corridors are overlaid the same way from DoT rail rasters.
The result is a combined map that reflects the total noise environment from all three transit sources: road, air, and rail. Thanks to the DoT for allowing this.
Smaller Airports
The Department of Transportation's aviation data covers major airports well, but misses many regional and municipal ones. We built a supplemental model to fill this gap.
The approach: we studied the airports the government does cover and learned the relationship between an airport's flight operations (from FAA Terminal Area Forecast data), its based aircraft, and its runway layout on one hand, and the size and shape of its noise footprint on the other. We then applied that learned relationship to predict noise footprints for airports the government missed.
We deliberately built this model to err on the side of caution. Predicted noise peaks are reduced by half the model's error margin. Predicted noise extents are contracted by 15%. A hard ceiling of 75 dBA prevents any synthetic airport from showing unrealistically loud. If the government already covers an airport, we skip it entirely and use their data instead.
The goal is to show you that a nearby regional airport generates some noise, not to overstate how much.
Minor Notes
Overlapping roads: Real neighborhoods do not have one road in isolation. They sit near intersections, on-ramps, parallel routes, and sometimes under flight paths. The model handles overlapping noise the way physics actually works: when two noise sources affect the same spot, we add their acoustic energy (not their decibel numbers) to get the true combined level. This matters more than most people expect. Two equally loud roads side by side do not produce twice the noise. They produce about 3 dBA more than either one alone. But that 3 dBA is real, perceivable, and adds up at busy interchanges where five or six roads converge. Simpler models that look at roads one at a time miss this entirely.
Making shapes that make sense: The colored shapes on the map (the noise “isobands”) are generated using two different methods depending on how loud the road is. Loud roads (60+ dBA) go through a grid-based process at 100-meter resolution. This is essential for highways and interchanges where multiple roads overlap and their noise combines. The grid correctly shows how noise from adjacent roads merges into a single louder zone. Quieter roads (below 60 dBA) are rendered as smooth buffers that follow the road's actual geometry. This produces cleaner, more natural-looking shapes for the thousands of neighborhood roads that do not interact with each other. After both are generated, we enforce a strict rule: a louder band always wins. If a highway puts your block in the “65-70 dBA” zone, no amount of quiet residential roads nearby will paint over that with green. The loudest source at any given point determines the color on the map.
City/zip/state page stats: When we talk about noise in a city, we're talking about block-level analysis that we've done for all 50 states at 100-meter resolution. We overlay it on approximately 8 million U.S. Census blocks and calculate acoustically-correct average noise levels, peak noise, and the percent of an area above 55 dBa. We then present these stats in various ways that we think real people might care about.
Limitations
No model is perfect, and we want to be transparent about where this one falls short.
- Terrain is approximated. The production map uses a single decay rate calibrated for developed areas. It slightly overestimates how far noise reaches through dense forest and slightly underestimates propagation over flat open terrain or water. This matters most in rural areas where one road dominates the landscape.
- State data quality varies. Each state's Department of Transportation reports road data to HPMS independently. Some states have thorough traffic counts on nearly every road. Others have gaps, especially on local streets. Where daily traffic counts are missing, we estimate them from road class, which adds uncertainty.
- Very low-traffic local roads are not shown. Local roads without measured traffic data, or with fewer than 1,500 vehicles per day, still contribute to the noise grid (they affect total energy calculations) but do not generate visible shapes on the map. This prevents the map from being carpeted in faint green polygons across states with hundreds of thousands of rural roads, but it means some genuinely noisy local roads may not appear.
- Military air bases are not included. Jet fighters, military transport aircraft, and low-altitude training flights are not represented in any of the civilian federal datasets we use. If you live near an active Air Force, Navy, or Marine Corps air station, the real noise may be substantially worse than what this map shows.
- Smaller airports are intentionally conservative. Our synthetic aviation predictions are deliberately under-stated relative to what we think reality might be.
How This Compares to Other Noise Maps
The Department of Transportation's National Transportation Noise Map is the closest publicly available equivalent. It is well-made and we use it as both calibration data and a direct overlay. Our map extends it in three ways:
- More roads. We score every road in the federal highway database, including minor collectors, local roads, and segments the government chose not to model. This adds substantial coverage in suburban and rural areas where the DoT map shows nothing.
- More airports. Our synthetic aviation model adds noise footprints for smaller airports missing from the government's aviation data.
- Queryable by address. We aggregate noise to Census blocks and roll up to neighborhoods, zip codes, and cities. You can look up a specific place and get a number, rather than having to visually interpret a raster image.
Where the government has data, our map uses it. Where they do not, ours extends it.
Thanks to the US DoT for their collaboration, interest, and permission in this project. All agency staff requested no personal attribution, but they know who they are.
10 Quietest Cities (100k+ pop)
- Lakewood, NJ: 48 dBA
- Lincoln, NE: 49 dBA
- Naples, FL: 49 dBA
- Tyler, TX: 49 dBA
- Bradenton, FL: 50 dBA
- Riverview, FL: 50 dBA
- Murfreesboro, TN: 50 dBA
- Ocala, FL: 50 dBA
- Olympia, WA: 50 dBA
- Clarksville, TN: 50 dBA
10 Loudest Cities (100k+ pop)
- Manhattan, NY: 63 dBA
- Bronx, NY: 61 dBA
- Boston, MA: 60 dBA
- Brooklyn, NY: 60 dBA
- Honolulu, HI: 60 dBA
- Queens, NY: 60 dBA
- Minneapolis, MN: 60 dBA
- Philadelphia, PA: 60 dBA
- Yonkers, NY: 59 dBA
- St. Louis, MO: 58 dBA