
Find the best place to live, down to the neighborhood
BestNeighborhood scores every neighborhood, town, and city in the United States on 40 measures of daily life, and lets anyone re-weight them for free. The rankings cover 53,313 places and reach 240,160 individual neighborhoods.
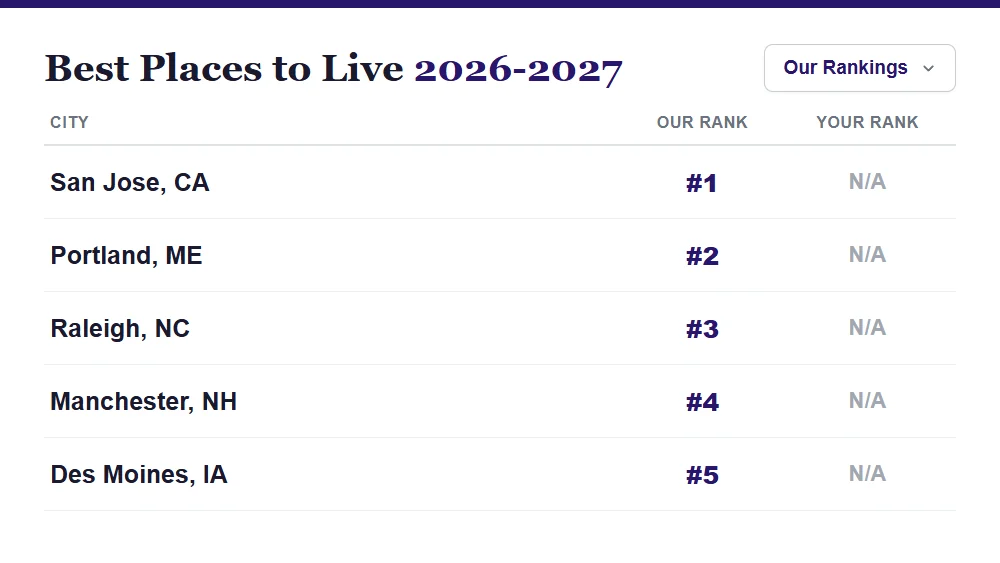
Ranked on 40 measures, and the weights are yours to change.
Step 1
Choose your best city
This tool is for people who can live anywhere: choosing between job offers in different cities, planning a move across the country, or still narrowing down a state. The 2026-2027 Best Places to Live rankings score 387 metro areas, 445 cities, and more than 50,000 towns on the same 40 measures.
Most rankings cover a few hundred cities and set the weights for you. BestNeighborhood ranks more than 53,000 places for free, each built on a rigorous methodology you can read in full. Push crime, cost, or schools up or down until the list matches your priorities.
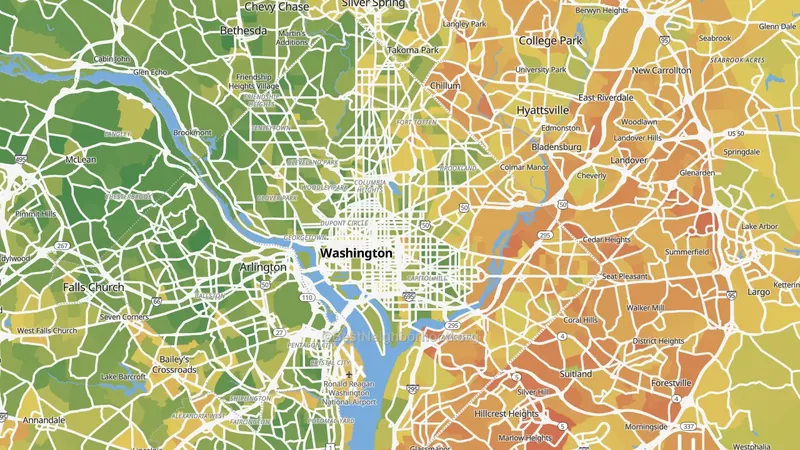
Washington, DC, scored neighborhood by neighborhood.
Step 2
Choose your best neighborhood
This tool is for people who already know the city: starting a job there next month, staying put and shopping for a house, or checking how their own street scores. Type a city or zip code below to open its neighborhood map.
A city ranking gives one number to millions of people. This map scores each neighborhood on its own, and inside a single metro the distance between the best and worst neighborhood is usually wider than the distance between the best and worst metro in the country. Weights set on the city rankings carry over. See how the neighborhood maps work.
Explore one measure at a time
Every measure behind the maps has its own page. These are some of the ones people open first.
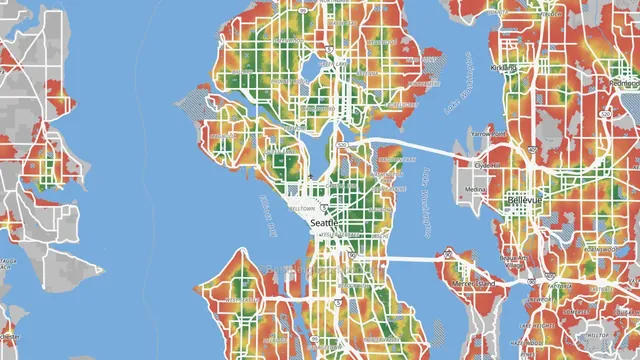
Walk Grade
Grades the real walk, the fast roads you cross and the traffic and tree shade along the way, instead of the straight-line distance most walk scores use.
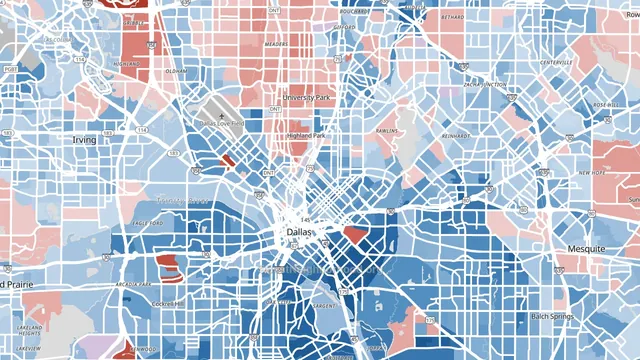
Political lean
Models left and right neighborhood by neighborhood from precinct returns, so the map matches the scale people actually move at.
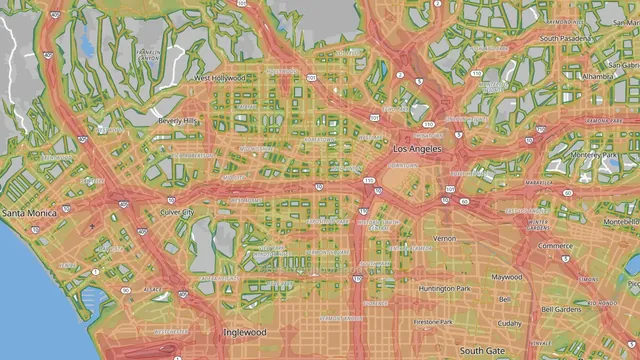
Transit noise
Maps road, rail, and aviation noise across the whole country, with custom road modeling down to 100 meters.
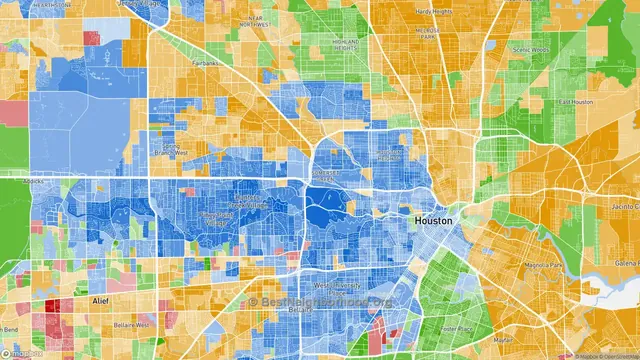
Race and diversity
Shades every neighborhood by its largest group and scores how mixed it is, from 0 for a single group to 83.3 for an even mix of six.
Internet service
Type an address to see which internet providers reach it and how fast, down to the street, built from FCC filings.
Cell coverage
Compares 4G and 5G coverage from every major carrier at street level, built from FCC filings.
More local data
These pages open the raw numbers for one city at a time. Houston is shown here as an example, and the demographics guide explains what each page covers.
See your city
Every metro holds a wide range of neighborhoods. Open the map for one of these, or search your own in the box above.

New York, NY
New York ranks 67th of 387 metros and has the most walkable neighborhoods in the country. Its strongest areas run from New Rochelle and White Plains to parts of Manhattan and Queens.

Los Angeles, CA
Los Angeles ranks 178th of 387 metros and gets about 287 pleasant-weather days a year, more than anywhere else. Its highest-scoring neighborhoods cluster around Torrance, Redondo Beach, and Irvine.

Chicago, IL
Chicago ranks 166th of 387 metros, held back by taxes and long commutes but lifted by a $102,339 median household income. Its top-scoring areas include Aurora, Naperville, and Evanston.

Houston, TX
Houston ranks 242nd of 387 metros, with a $95,757 median household income and its best-scoring neighborhoods out in Cypress, The Woodlands, Sugar Land, and Richmond.

Austin, TX
Austin ranks 9th of 387 metros and has grown 31% in a decade to 2.55 million people. Its highest-scoring neighborhoods sit west of the city around Lakeway, Bee Cave, and Cedar Park.

Seattle, WA
Seattle ranks 35th of 387 metros, with a $128,699 median household income and its strongest neighborhoods across Bellevue, Renton, Sammamish, and Edmonds.
About BestNeighborhood
BestNeighborhood is a free mapping site that scores every neighborhood, town, city, and metro area in the United States on 40 measures of daily life. It exists to answer a practical question with data instead of opinion: for the way a specific household lives, which places fit best.
The maps and rankings are built and maintained by the BestNeighborhood data science team. Every measure starts from primary sources, among them the Census Bureau, the FCC, FEMA, the EPA, the CDC, and NOAA, and is calculated for small areas of about 1,250 residents before it rolls up to a neighborhood, city, or state. Each measure has its own methodology write-up, so any number on the site can be traced to where it came from.
Several inputs exist nowhere else at this detail. The Walk Grade measures the trip instead of the distance. Political lean and religious adherence are mapped to small areas. Crime cost is corrected for the fact that some states report far less than they experience. Scores are absolute rather than graded on a curve, so a 60 for schools means the same thing in every city. Detailed data packages are sold to businesses, and the public maps stay free.