The map shows where residents in Redmont Park and surrounding areas believe are the best places to live. Top areas are in dark green, with less-desired areas in red.
The map shows where residents in Redmont Park and surrounding areas believe are the best places to live. Top areas are in dark green, with less-desired areas in red.
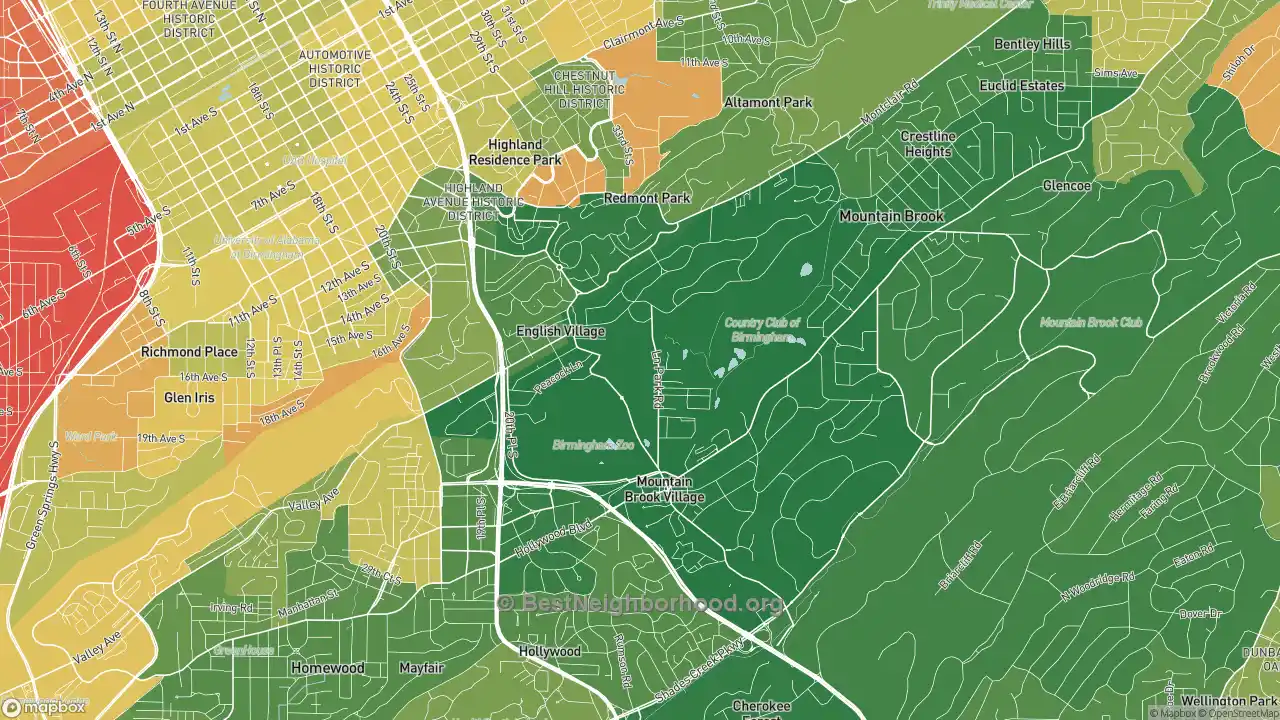
The most desired areas tend to be in the north parts of the neighborhood, while more affordable homes are in the southwest regions.
Median house prices in Redmont Park, Birmingham, AL are $1,082,931, meaning Redmont Park homes are much more expensive than the US median of $393,134. We also analyzed a significant sample of neighborhoods with similar populations and found homes in Redmont Park cost much more.
Comparing within Birmingham, Redmont Park home prices are much more expensive than the city’s average of $261,464. These are the best neighborhoods as judged by the market: the places people most want to live. While these areas tend to have lower crime rates and higher quality of life, it is primarily a map of the best areas by median home value in Redmont Park, Birmingham, AL.
In regards to housing disparity, the quality of neighborhood within Redmont Park varies greatly.
Schools are a key consideration for many movers. Using SchoolGrade data, Schools in Redmont Park, Birmingham, AL average a SchoolGrade of B+ with 51% actual proficiency vs 49% projected. Overall, schools in Redmont Park, Birmingham, AL exceed expectations.
Another important factor that contributes to the quality of life in any neighborhood is the availability and speed of internet services. A high-speed internet connection can significantly enhance day-to-day experiences, from working at home to streaming entertainment or even viewing interactive maps like these. For those interested in high speed internet in Redmont Park, a visit to ispreports.org provides a comprehensive look at available internet providers.
Data Sources: U.S. Census, proprietary data mapping and analysis
No other site shows detail at this level for free. We are able to keep this site free by receiving a small commission from the referring links on this page. Please share or cite this page if you aren’t able to otherwise support our work. Note that big changes are coming to this page in particular to add much more detail.
Updated 2023 using the most recent data available (2021)