31798 is a Republican stronghold. About 14% of voters here vote Democratic and 86% Republican.
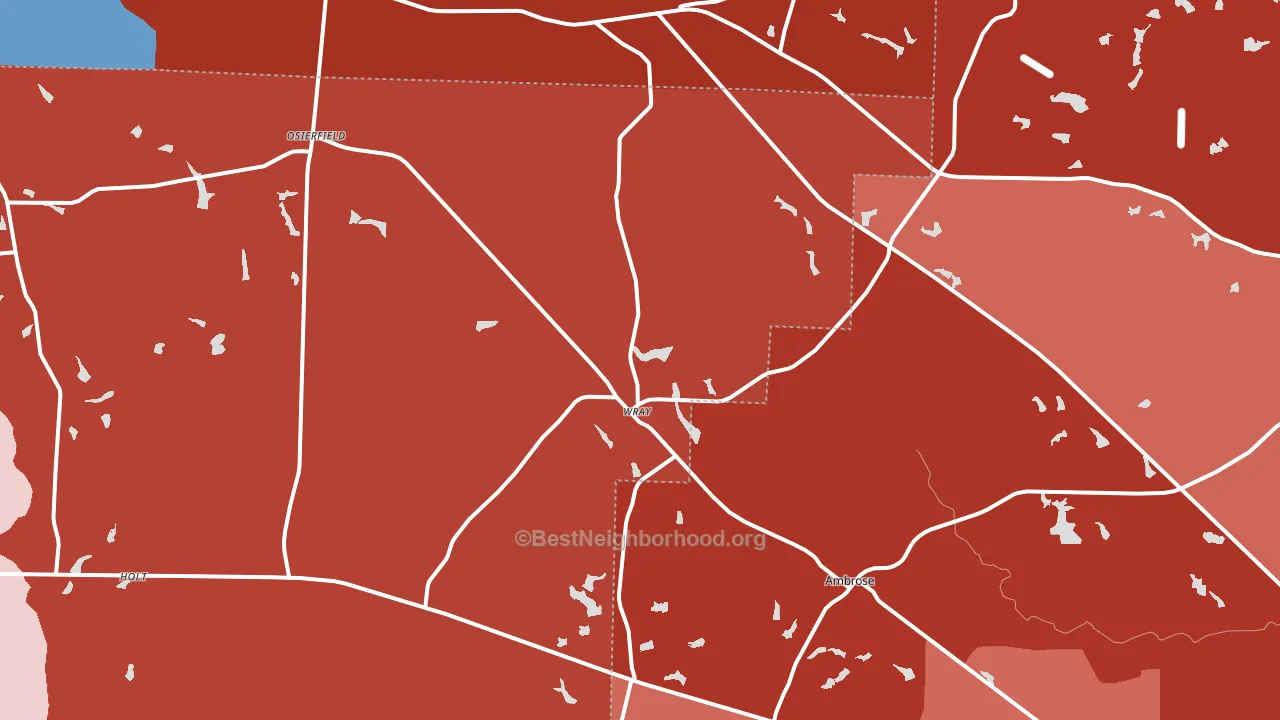
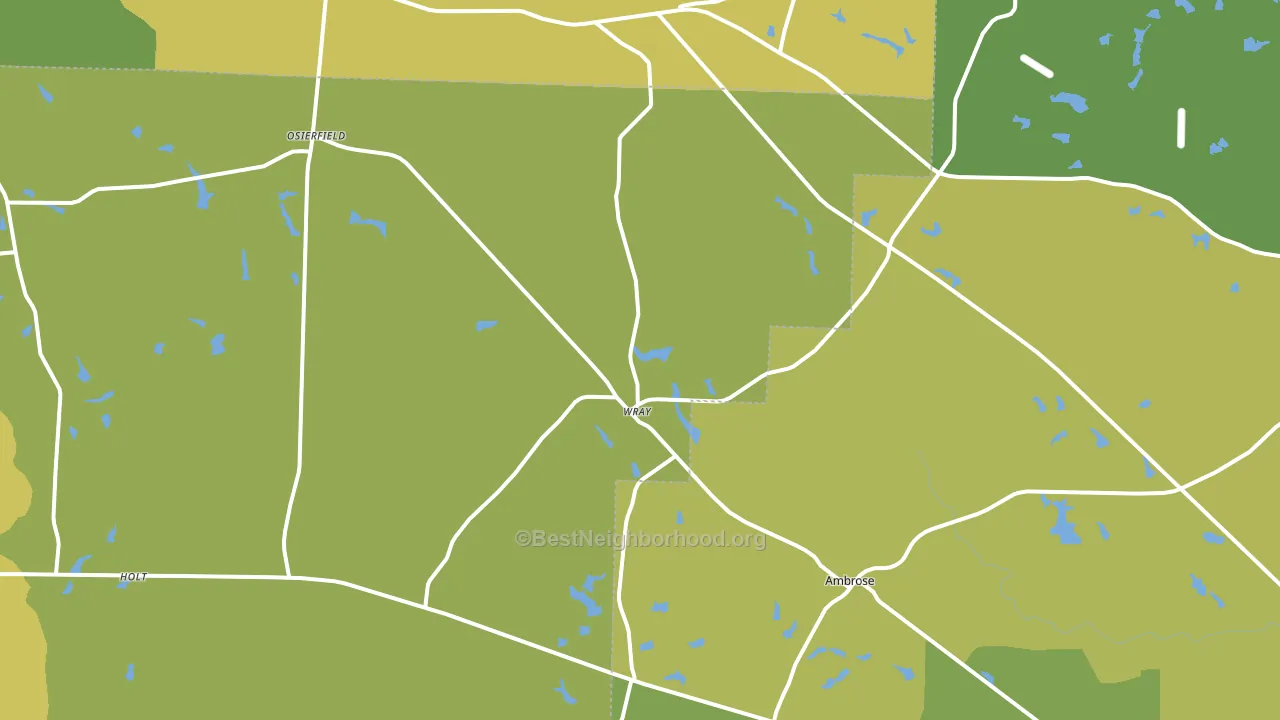
About 69% of adults in 31798 typically vote, above the U.S. average of about 62%. Among adults in 31798, ~10% vote Democratic, ~59% Republican, and ~31% don't vote. The map below shows estimated turnout by block group.
How 31798 compares
Among zip codes within 15 miles, 31798 is the most Republican-leaning.
31798 runs about 71 points more Republican than Georgia as a whole.
Why 31798 leans the way it does
This analysis examined 14,881 data points per zip code to find what predicts political lean and turnout. The items below are a few correlations that stood out for 31798, not a ranked or complete list of what matters most.
Areas with many family households vote Republican. About 74% of households in 31798 are family households, about 7 points above the U.S. average of 67%.
Population density and Republican lean
Places with low population density tend to lean Republican; 31798, GA sits in the bottom quarter nationally on this measure.
Why turnout in 31798 looks the way it does
Homeowners vote more often than renters. About 92% of households in 31798 own their home, about 19 points above the Georgia average of 73%. Limited routine healthcare access lines up with lower turnout, and 31798 sits in the bottom quarter on routine-care measures. Learn more about the findings and methodology on the political spectrum map.
Nearby Zip Codes
Zip Codes with Similar Populations
Sources and methodology
Precinct-level voting records used to fit the model come from Georgia Elections Division, distributed by the Voting and Election Science Team. Demographic inputs come from the U.S. Census Bureau (ACS 5-year estimates and the 2020 Decennial Census). Health and environmental inputs come from the CDC (PLACES and the Environmental Justice Index). Land cover comes from the USGS and EPA. Election-day and lead-up weather come from PRISM 4km daily grids and the NOAA Global Historical Climatology Network. Mail-voting and election-administration patterns come from the MIT Election Lab's Survey of the Performance of American Elections. Block-group crime detail comes from CrimeGrade. Internet data and modeling support provided by ISPreports.org.
Modeling and analysis by the BestNeighborhood data science team. Full methodology and findings: political spectrum map.
Methodology reviewed by the BestNeighborhood data team. Last updated May 2026.