Allegany County leans heavily Republican by roughly 38 points: about 31% of voters vote Democratic and 69% Republican.
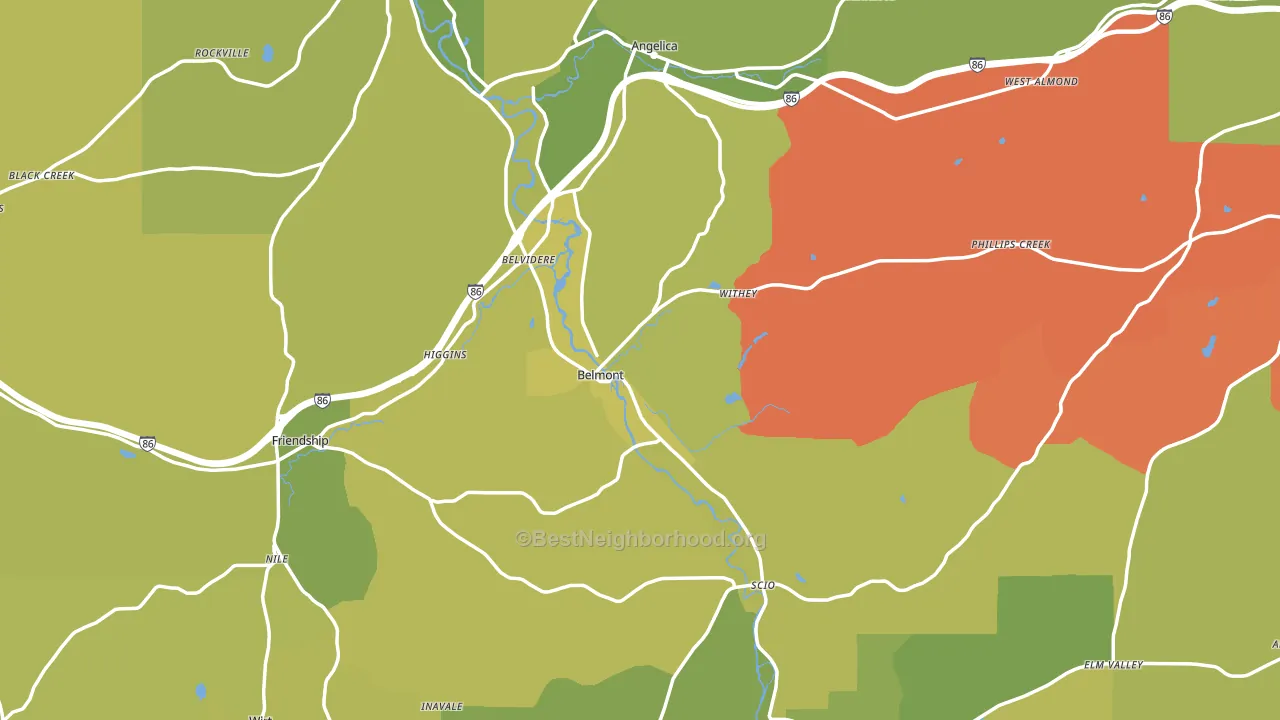
About 63% of adults in Allegany County typically vote, near the U.S. average of about 62%. Among adults in Allegany County, ~20% vote Democratic, ~43% Republican, and ~37% don't vote. The map below shows estimated turnout by block group.
How Allegany County compares
Among counties within 50 miles, Allegany County leans more Republican than 3 of 6 neighbors.
Allegany County runs about 51 points more Republican than New York as a whole. New York leans Democratic overall, while Allegany County is one of the few Republican-leaning pockets.
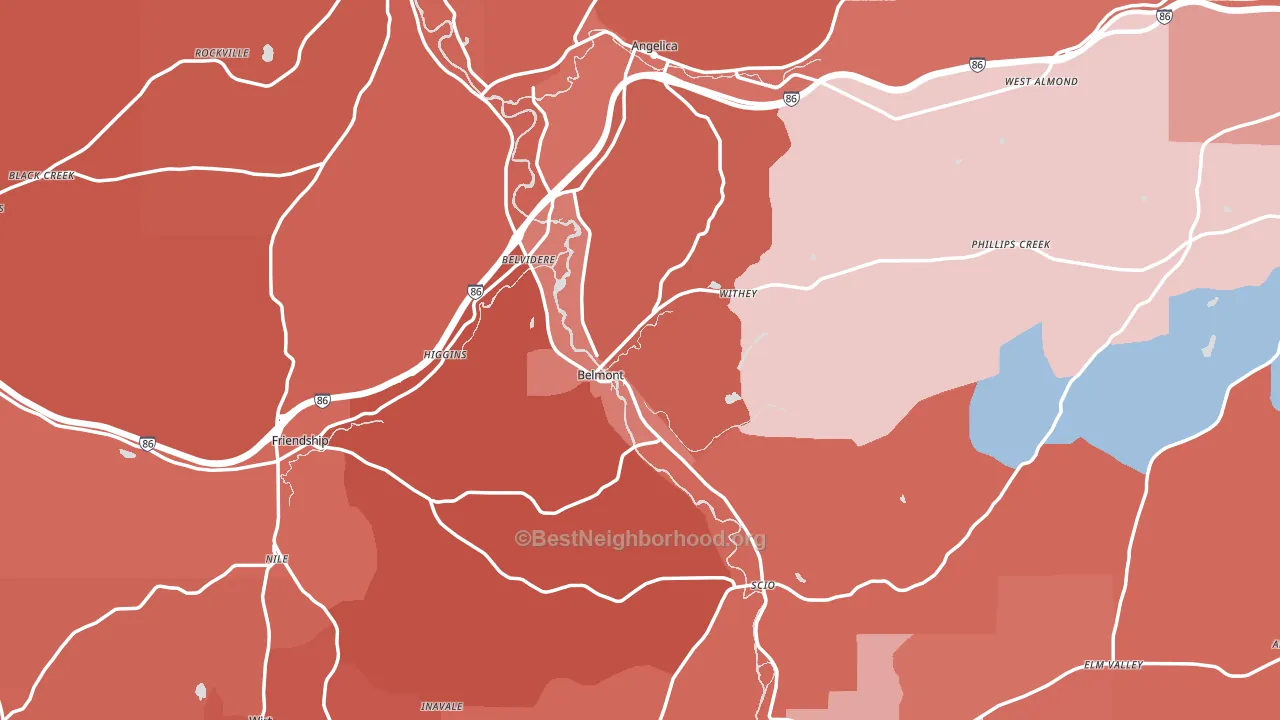
Politics vary noticeably by city within Allegany County. The northeast side is the most Republican-leaning (R+49) and the east side is the least Republican-leaning (R+11), a spread of about 38 points.
Why Allegany County leans the way it does
This analysis examined 14,881 data points per county to find what predicts political lean and turnout. The items below are a few correlations that stood out for Allegany County, not a ranked or complete list of what matters most.
Allegany County votes against the grain of New York. New York leans Democratic overall, while Allegany County runs about 51 points more Republican. Rural areas with a high white share vote Republican. Non-Hispanic white share in Allegany County is about 93%, about 21 points above the U.S. average of 72%.
Population density, never-married share, and Republican lean
Places that combine low population density and a never-married-heavy adult population tend to lean Republican, as Allegany County, NY does.
Why turnout in Allegany County looks the way it does
Turnout in Allegany County sits close to the national pattern. Routine healthcare access, homeownership, education, and food security all land near their national averages here. Learn more about the findings and methodology on the political spectrum map.
Nearby Counties
- Potter County, PA R+58
- Cattaraugus County, NY R+29
- Wyoming County, NY R+39
- Steuben County, NY R+32
- McKean County, PA R+43
- Livingston County, NY R+19
- Tioga County, PA R+50
- Cameron County, PA R+47
- Genesee County, NY R+29
- Yates County, NY R+28
Counties with Similar Populations
- Clinton County, IA R+21
- Stevens County, WA R+37
- Jackson County, IN R+51
- Auglaize County, OH R+59
- Charlottesville City, VA D+60
- Chambers County, TX R+58
- Monroe County, WI R+28
- Monroe County, TN R+67
- Beltrami County, MN R+4
- Barron County, WI R+28
Sources and methodology
Precinct-level voting records used to fit the model come from New York State Board of Elections, distributed by the Voting and Election Science Team. Demographic inputs come from the U.S. Census Bureau (ACS 5-year estimates and the 2020 Decennial Census). Health and environmental inputs come from the CDC (PLACES and the Environmental Justice Index). Land cover comes from the USGS and EPA. Election-day and lead-up weather come from PRISM 4km daily grids and the NOAA Global Historical Climatology Network. Mail-voting and election-administration patterns come from the MIT Election Lab's Survey of the Performance of American Elections. Block-group crime detail comes from CrimeGrade. Internet data and modeling support provided by ISPreports.org.
Modeling and analysis by the BestNeighborhood data science team. Full methodology and findings: political spectrum map.
Methodology reviewed by the BestNeighborhood data team. Last updated May 2026.