Artois is a Republican stronghold. About 20% of voters here vote Democratic and 80% Republican.
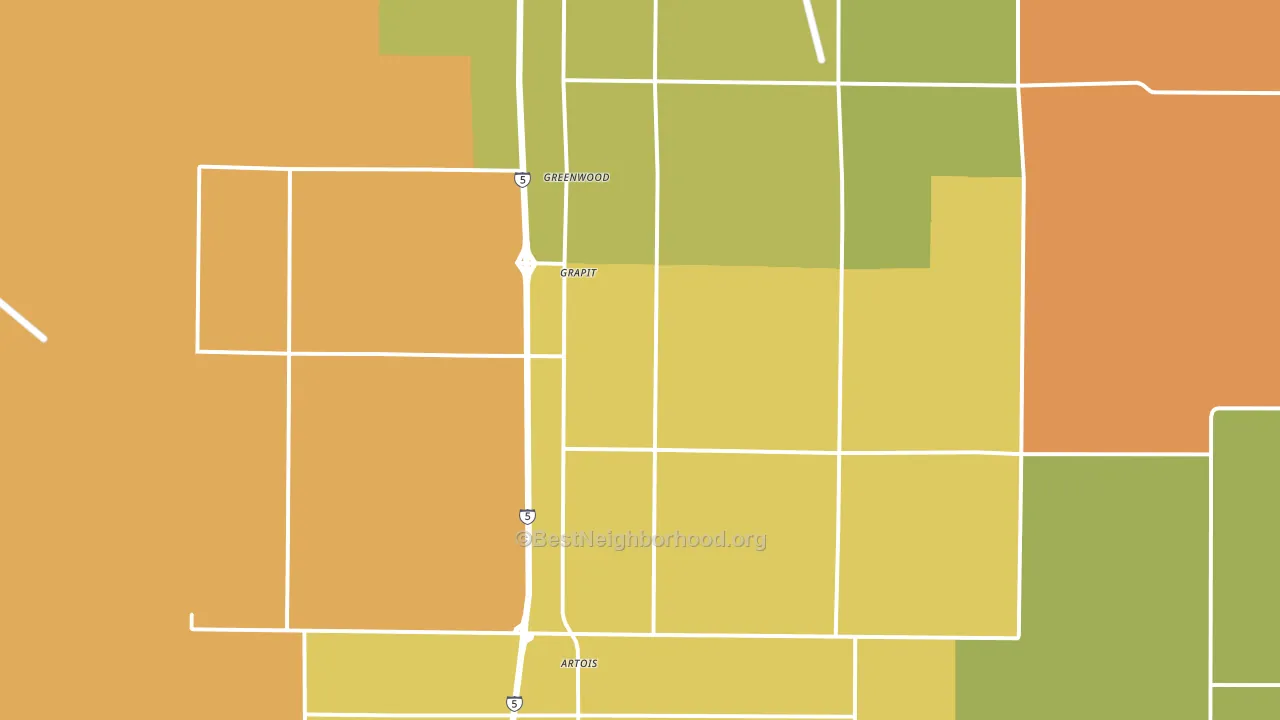
About 55% of adults in Artois typically vote, below the U.S. average of about 62%. Among adults in Artois, ~11% vote Democratic, ~44% Republican, and ~45% don't vote. The map below shows estimated turnout by block group.
How Artois compares
Among cities within 25 miles, Artois leans more Republican than 19 of 23 neighbors.
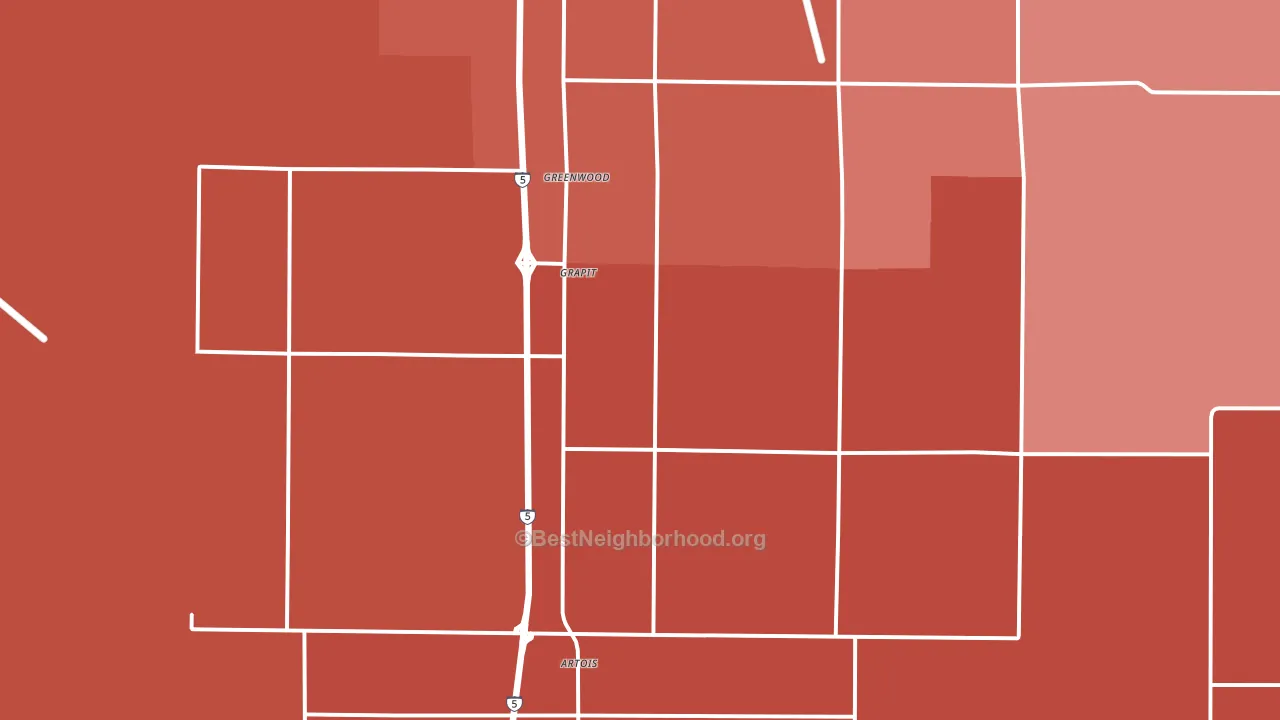
Artois runs about 81 points more Republican than California as a whole. California leans Democratic overall, while Artois is one of the few Republican-leaning pockets.
Politics vary noticeably by neighborhood within Artois. The southeast side is the most Republican-leaning (R+70) and the northeast side is the least Republican-leaning (R+52), a spread of about 18 points.
Why Artois leans the way it does
This analysis examined 14,881 data points per city to find what predicts political lean and turnout. The items below are a few correlations that stood out for Artois, not a ranked or complete list of what matters most.
Artois votes against the grain of California. California leans Democratic overall, while Artois runs about 81 points more Republican. A high family-household share predicts Republican voting, and about 78% of households in Artois are family households, above 85% of cities.
Homeownership and voter turnout
Places with renter-heavy households tend to turn out at a lower rate; Artois, CA sits in the bottom quarter nationally on this measure.
Why turnout in Artois looks the way it does
Renters vote less often than owners. About 31% of households in Artois rent, about 6 points above the U.S. average of 25%. Learn more about the findings and methodology on the political spectrum map.
Nearby Cities
- Orland, CA R+31
- Glenn, CA R+64
- Ordbend, CA R+51
- Mills Orchard, CA R+46
- Willows, CA R+33
- Hamilton City, CA Even
- Rotavele, CA R+27
- Fruto, CA R+62
- Newville, CA R+59
- Butte City, CA R+62
Cities with Similar Populations
- Machiasport, ME R+23
- Jacks Creek, TN R+72
- San Patricio, TX R+59
- Chatsworth, NJ R+37
- Luella, GA R+33
- Olympia Springs, KY R+64
- Sedgewickville, MO R+72
- Swea City, IA R+52
- Phoenix, GA R+56
- Hudson, WY R+61
Sources and methodology
Precinct-level voting records used to fit the model come from California Secretary of State, Elections, distributed by the Voting and Election Science Team. Demographic inputs come from the U.S. Census Bureau (ACS 5-year estimates and the 2020 Decennial Census). Health and environmental inputs come from the CDC (PLACES and the Environmental Justice Index). Land cover comes from the USGS and EPA. Election-day and lead-up weather come from PRISM 4km daily grids and the NOAA Global Historical Climatology Network. Mail-voting and election-administration patterns come from the MIT Election Lab's Survey of the Performance of American Elections. Block-group crime detail comes from CrimeGrade. Internet data and modeling support provided by ISPreports.org.
Modeling and analysis by the BestNeighborhood data science team. Full methodology and findings: political spectrum map.
Methodology reviewed by the BestNeighborhood data team. Last updated May 2026.