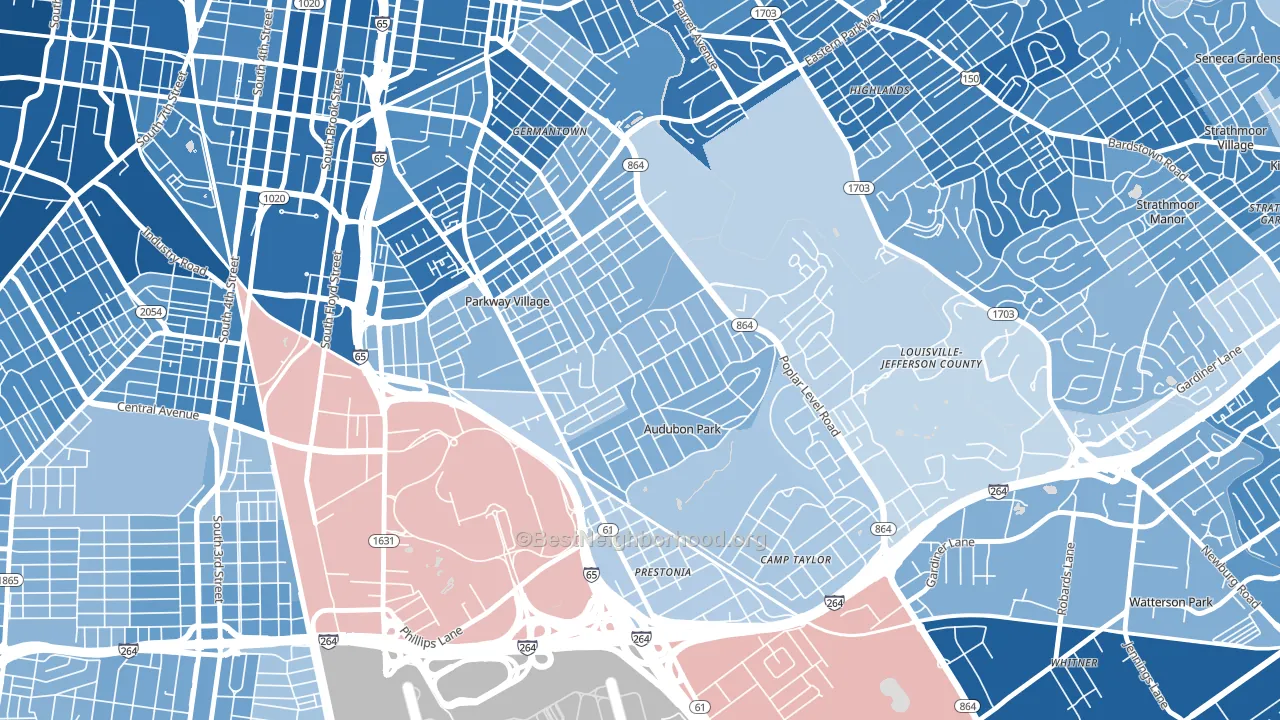
Audubon leans Democratic by roughly 24 points: about 62% of voters vote Democratic and 38% Republican.
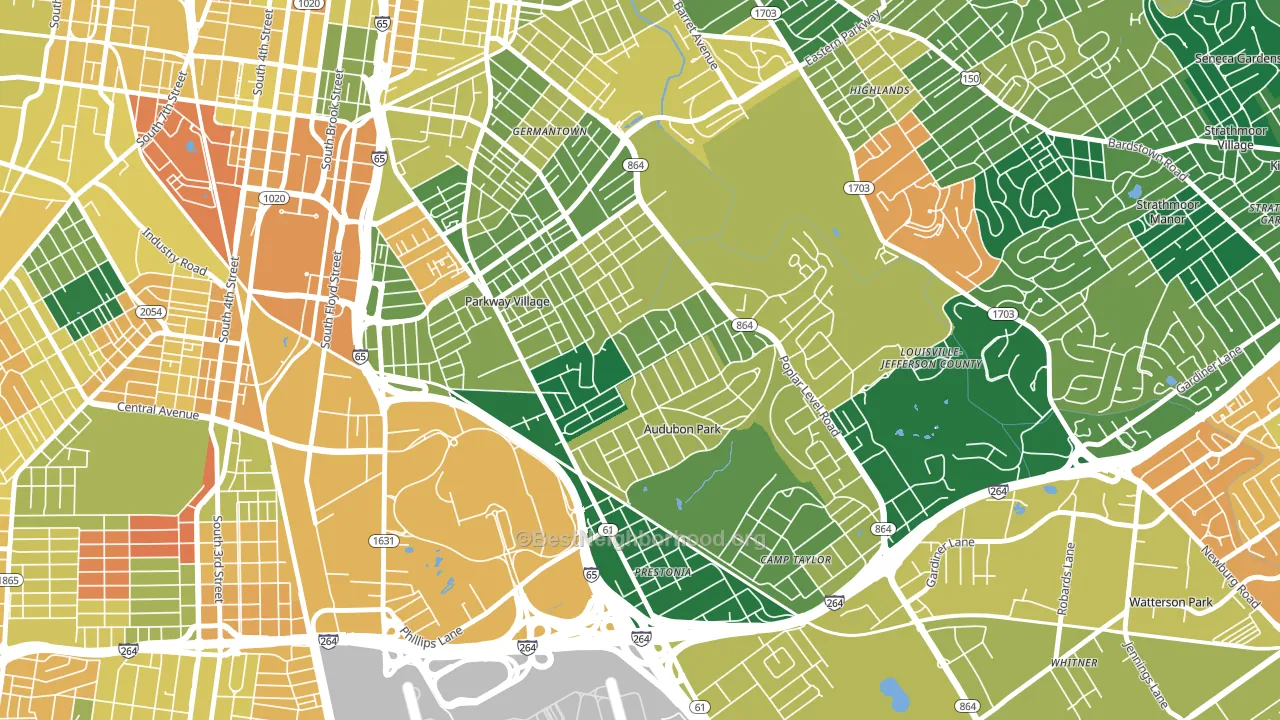
About 74% of adults in Audubon typically vote, above the U.S. average of about 62%. Among adults in Audubon, ~46% vote Democratic, ~28% Republican, and ~26% don't vote. The map below shows estimated turnout by block group.
How Audubon compares
Among neighborhoods within 5 miles, Audubon leans more Democratic than 5 of 31 neighbors.
Audubon runs about 55 points more Democratic than Kentucky as a whole. Kentucky leans Republican overall, while Audubon is one of the few Democratic-leaning pockets.
Politics vary noticeably by block within Audubon. The north side is the most Democratic-leaning (D+29) and the southeast side is the least Democratic-leaning (D+17), a spread of about 13 points.
Why Audubon leans the way it does
This analysis examined 14,881 data points per neighborhood to find what predicts political lean and turnout. The items below are a few correlations that stood out for Audubon, not a ranked or complete list of what matters most.
Audubon votes against the grain of Kentucky. Kentucky leans Republican overall, while Audubon runs about 55 points more Democratic.
Cancer-screening access and voter turnout
Places with high colon-cancer-screening access tend to turn out at a higher rate; Audubon, Louisville, KY sits in the top tenth nationally on this measure. Cancer screening does not drive turnout; it reflects income, insurance, and healthcare access.
Why turnout in Audubon looks the way it does
Areas with strong routine healthcare access turn out at higher rates. Audubon is in the top quarter nationally for routine-care measures such as insurance coverage, preventive screenings, and dental visits. The dental-visit rate here is about 68%, about 8 points above the U.S. average of 60%. Learn more about the findings and methodology on the political spectrum map.
Nearby Neighborhoods
- Schnitzelburg, Louisville, KY D+53
- Saint Joseph, Louisville, KY D+51
- Germantown, Louisville, KY D+59
- Deer Park, Louisville, KY D+61
- Belknap, Louisville, KY D+49
- Cherokee Triangle, Louisville, KY D+60
- South Louisville, Louisville, KY D+40
- Old Louisville, Louisville, KY D+66
- Highlands Douglass, Louisville, KY D+57
- Wyandotte, Louisville, KY D+23
Neighborhoods with Similar Populations
- Hickory Grove, Charlotte, NC D+53
- Grand, Riverside, CA D+4
- College Park, Ladson, SC R+5
- Fairmeadow, Palo Alto, CA D+43
- Southwest Village, Wichita, KS R+15
- East Albany, Albany, OR R+18
- Williston North, Williston, VT D+25
- Arvada Plaza Area, Arvada, CO D+28
- Johnston-McAlpine, Charlotte, NC D+17
- Delawanna, Clifton, NJ R+7
Sources and methodology
Precinct-level voting records used to fit the model come from Kentucky State Board of Elections, distributed by the Voting and Election Science Team. Demographic inputs come from the U.S. Census Bureau (ACS 5-year estimates and the 2020 Decennial Census). Health and environmental inputs come from the CDC (PLACES and the Environmental Justice Index). Land cover comes from the USGS and EPA. Election-day and lead-up weather come from PRISM 4km daily grids and the NOAA Global Historical Climatology Network. Mail-voting and election-administration patterns come from the MIT Election Lab's Survey of the Performance of American Elections. Block-group crime detail comes from CrimeGrade. Internet data and modeling support provided by ISPreports.org.
Modeling and analysis by the BestNeighborhood data science team. Full methodology and findings: political spectrum map.
Methodology reviewed by the BestNeighborhood data team. Last updated May 2026.