Barnes County leans heavily Republican by roughly 36 points: about 32% of voters vote Democratic and 68% Republican.
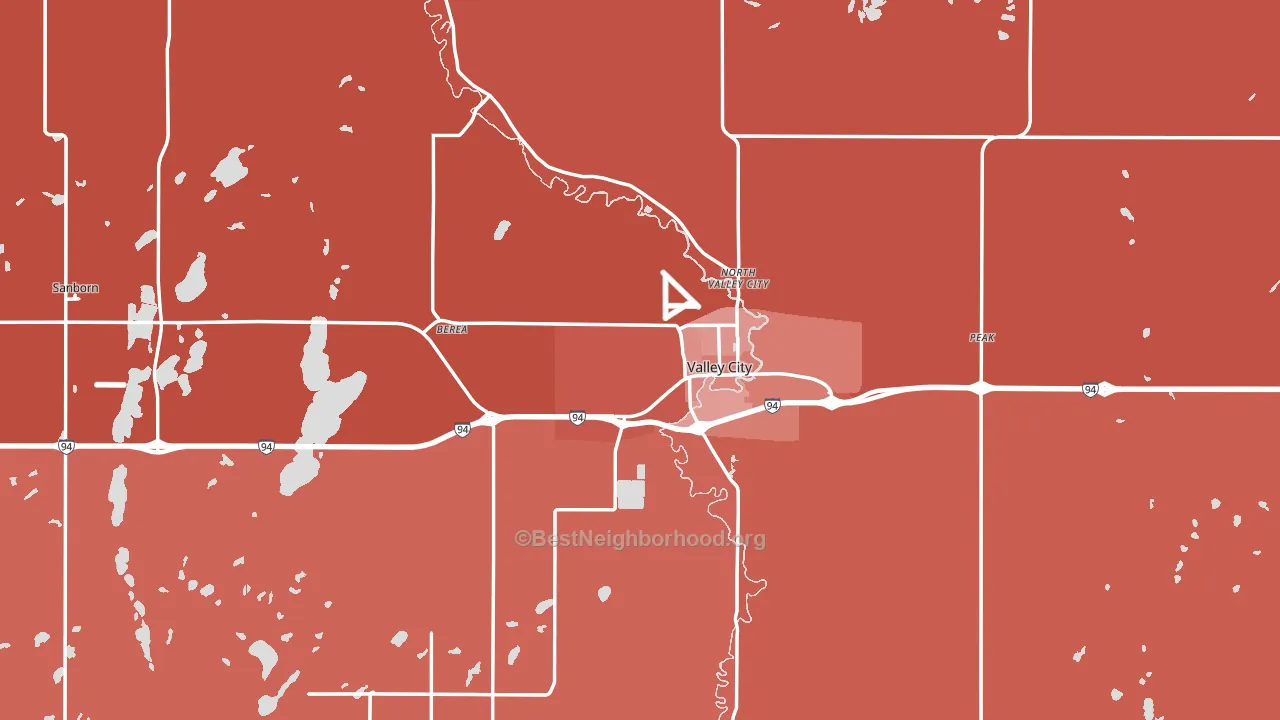
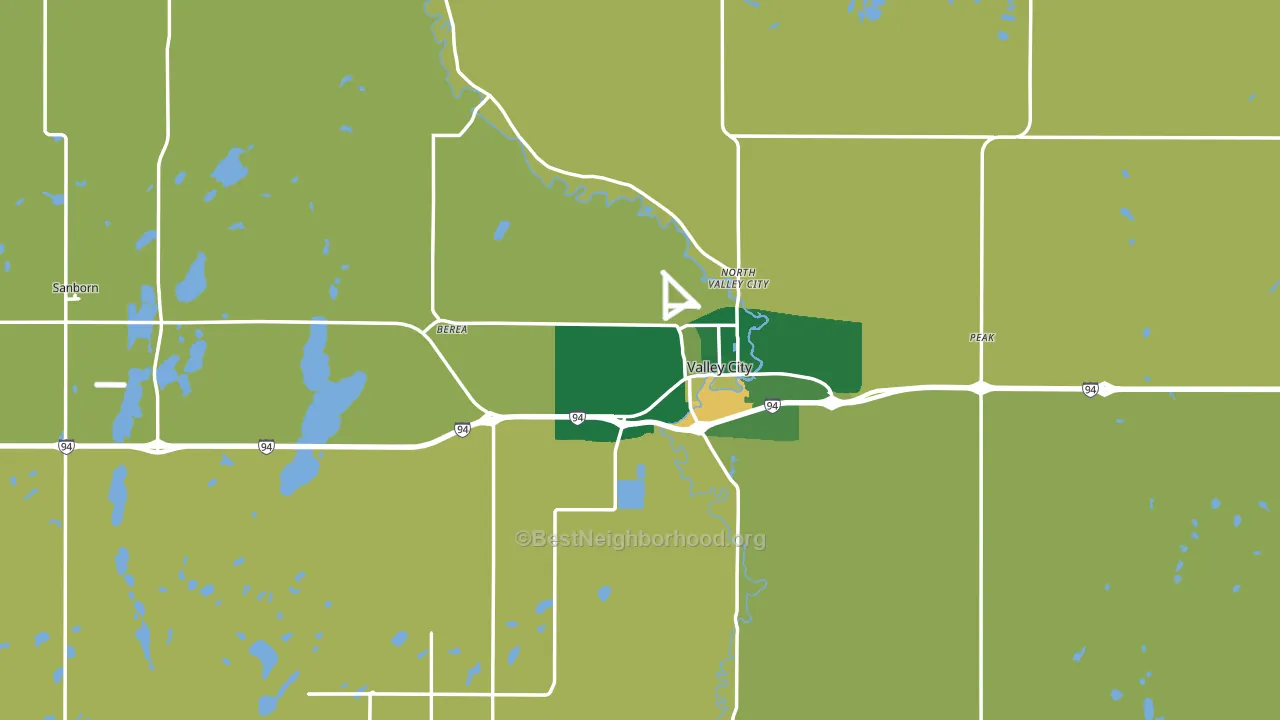
About 75% of adults in Barnes County typically vote, above the U.S. average of about 62%. Among adults in Barnes County, ~24% vote Democratic, ~51% Republican, and ~25% don't vote. The map below shows estimated turnout by block group.
How Barnes County compares
Among counties within 50 miles, Barnes County leans more Republican than 2 of 5 neighbors.
Politically, Barnes County sits close to the rest of North Dakota.
Why Barnes County leans the way it does
Density, race composition, education, and family structure all sit close to their national averages in Barnes County. The lean here lands roughly where demographic data alone would predict.
Food insecurity and voter turnout
Places with low food insecurity tend to turn out at a higher rate; Barnes County, ND sits in the bottom tenth nationally on this measure. Food insecurity does not directly drive turnout; it reflects economic hardship, which lines up with lower voting.
Why turnout in Barnes County looks the way it does
Areas with high high-school completion turn out at higher rates. About 94% of adults in Barnes County have completed high school, above 84% of counties. Learn more about the findings and methodology on the political spectrum map.
Nearby Counties
- Stutsman County, ND R+34
- Ransom County, ND R+46
- Griggs County, ND R+52
- Steele County, ND R+33
- LaMoure County, ND R+57
- Traill County, ND R+37
- Cass County, ND R+5
- Sargent County, ND R+50
- Dickey County, ND R+55
- Foster County, ND R+50
Counties with Similar Populations
- Early County, GA R+6
- Box Butte County, NE R+55
- Louisa County, IA R+37
- Mackinac County, MI R+19
- Lincoln County, WA R+54
- Sussex County, VA Even
- Alleghany County, NC R+58
- Pushmataha County, OK R+70
- Carroll County, KY R+51
- Lake County, MN R+5
Sources and methodology
Precinct-level voting records used to fit the model come from North Dakota Secretary of State, Elections, distributed by the Voting and Election Science Team. Demographic inputs come from the U.S. Census Bureau (ACS 5-year estimates and the 2020 Decennial Census). Health and environmental inputs come from the CDC (PLACES and the Environmental Justice Index). Land cover comes from the USGS and EPA. Election-day and lead-up weather come from PRISM 4km daily grids and the NOAA Global Historical Climatology Network. Mail-voting and election-administration patterns come from the MIT Election Lab's Survey of the Performance of American Elections. Block-group crime detail comes from CrimeGrade. Internet data and modeling support provided by ISPreports.org.
Modeling and analysis by the BestNeighborhood data science team. Full methodology and findings: political spectrum map.
Methodology reviewed by the BestNeighborhood data team. Last updated May 2026.