Brookfield leans heavily Republican by roughly 34 points: about 33% of voters vote Democratic and 67% Republican.
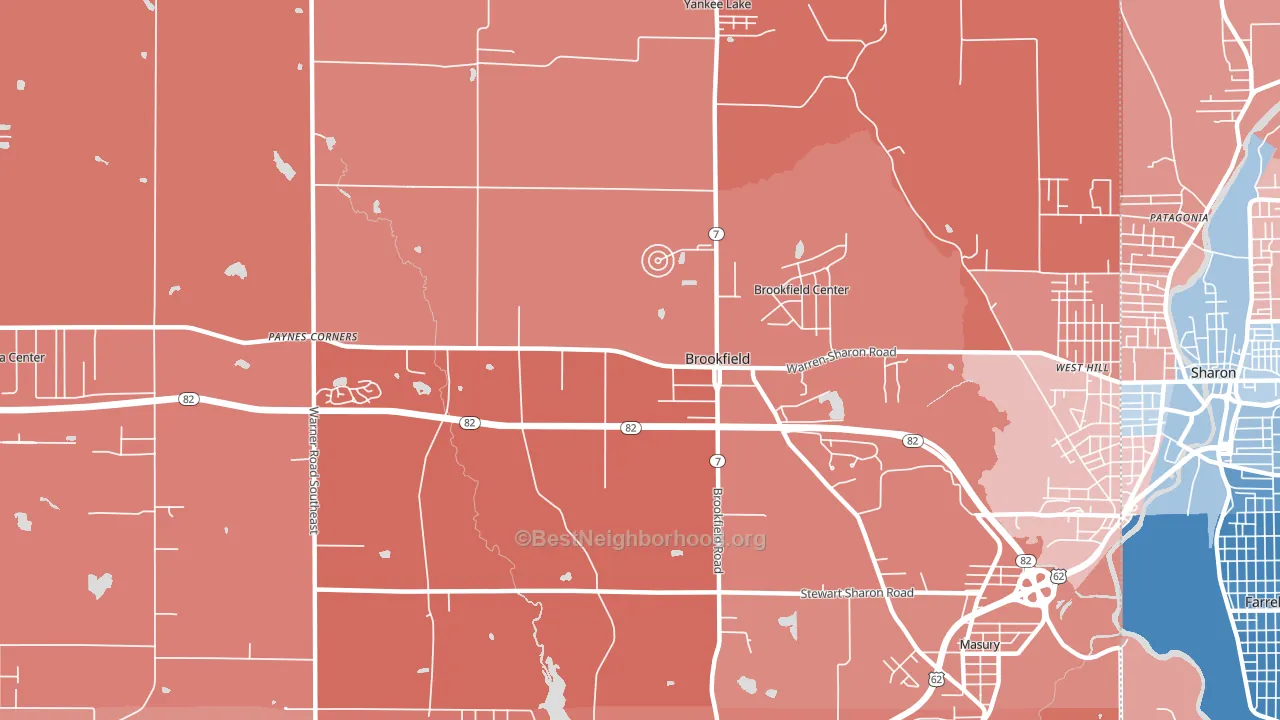
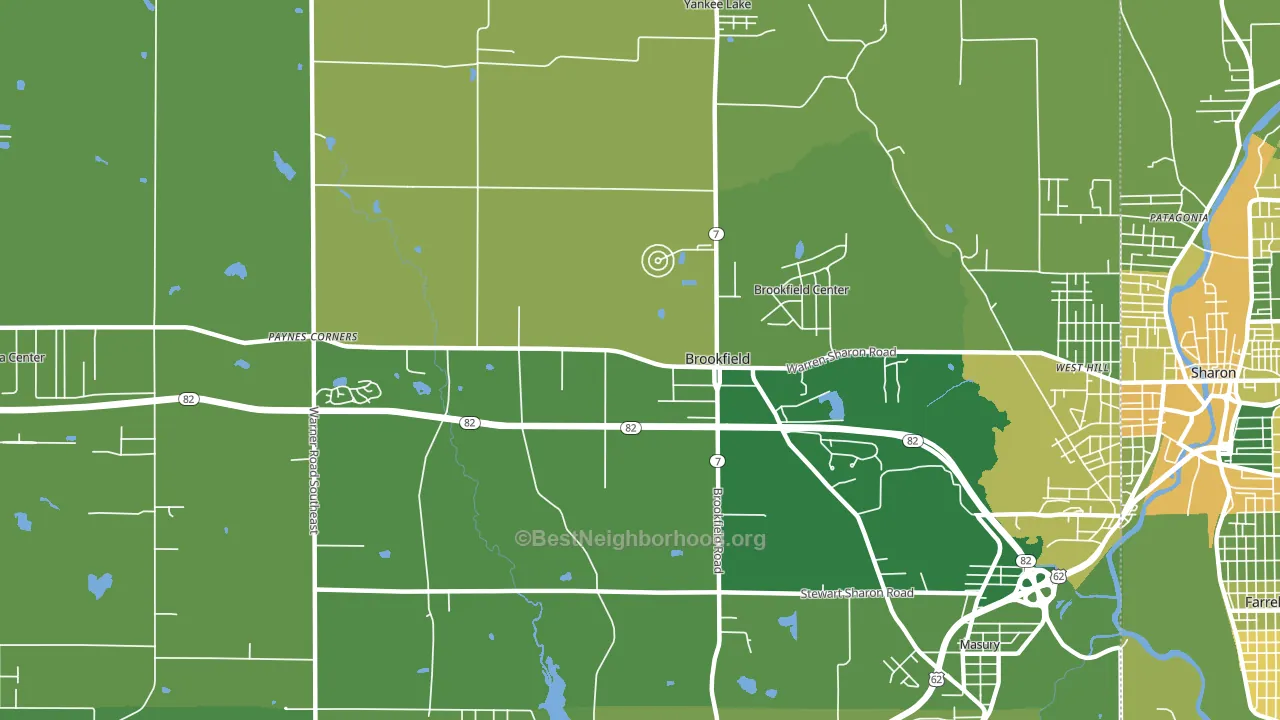
About 86% of adults in Brookfield typically vote, above the U.S. average of about 62%. Among adults in Brookfield, ~28% vote Democratic, ~58% Republican, and ~14% don't vote. The map below shows estimated turnout by block group.
How Brookfield compares
Among cities within 25 miles, Brookfield leans more Republican than 30 of 107 neighbors.
Brookfield runs about 22 points more Republican than Ohio as a whole.
Why Brookfield leans the way it does
This analysis examined 14,881 data points per city to find what predicts political lean and turnout. The items below are a few correlations that stood out for Brookfield, not a ranked or complete list of what matters most.
Brookfield votes Republican even though it is densely developed (about 31%, about 6 points below the U.S. average of 36%). Here an older population outweighs the Democratic lean that density usually predicts.
Cancer-screening access and voter turnout
Places with high colon-cancer-screening access tend to turn out at a higher rate; Brookfield, OH sits above the national average on this measure. Cancer screening does not drive turnout; it reflects income, insurance, and healthcare access.
Why turnout in Brookfield looks the way it does
Areas with high high-school completion turn out at higher rates. About 97% of adults in Brookfield have completed high school, about 6 points above the Ohio average of 91%. Learn more about the findings and methodology on the political spectrum map.
Nearby Cities
- Tyrrell, OH R+34
- Masury, OH R+21
- Yankee Lake, OH R+41
- Sharon, PA D+4
- Halls Corners, OH R+33
- Farrell, PA D+43
- Vienna, OH R+38
- Hubbard, OH R+19
- Wheatland, PA R+6
- Sharpsville, PA R+25
Cities with Similar Populations
- Oakville, WA R+23
- Springfield, MN R+51
- Glenelg, MD D+15
- Clayton, WA R+49
- Wentworth, NC R+50
- Lincoln Heights, OH D+89
- Elizabethtown, IN R+60
- Hanna City, IL R+32
- Kimball, NE R+66
- Little Mountain, SC R+50
Sources and methodology
Precinct-level voting records used to fit the model come from Ohio Secretary of State, Elections, distributed by the Voting and Election Science Team. Demographic inputs come from the U.S. Census Bureau (ACS 5-year estimates and the 2020 Decennial Census). Health and environmental inputs come from the CDC (PLACES and the Environmental Justice Index). Land cover comes from the USGS and EPA. Election-day and lead-up weather come from PRISM 4km daily grids and the NOAA Global Historical Climatology Network. Mail-voting and election-administration patterns come from the MIT Election Lab's Survey of the Performance of American Elections. Block-group crime detail comes from CrimeGrade. Internet data and modeling support provided by ISPreports.org.
Modeling and analysis by the BestNeighborhood data science team. Full methodology and findings: political spectrum map.
Methodology reviewed by the BestNeighborhood data team. Last updated May 2026.