Brooks leans Republican by roughly 24 points: about 38% of voters vote Democratic and 62% Republican.
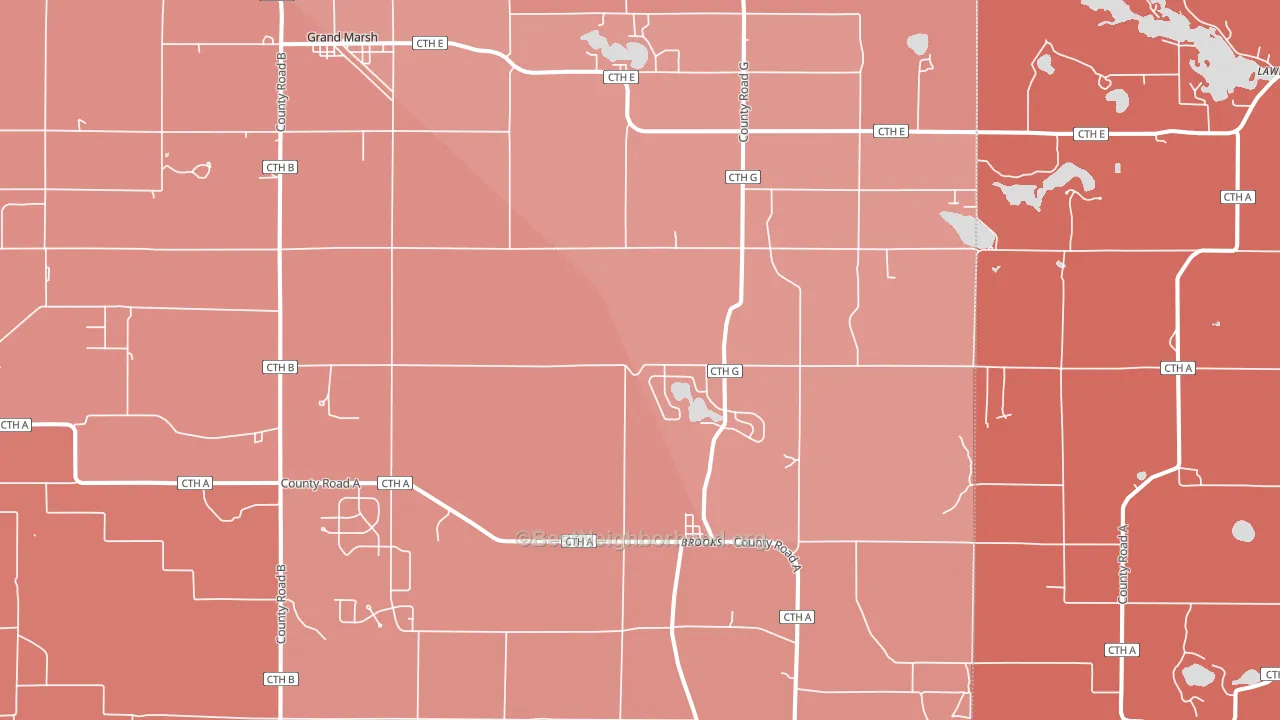
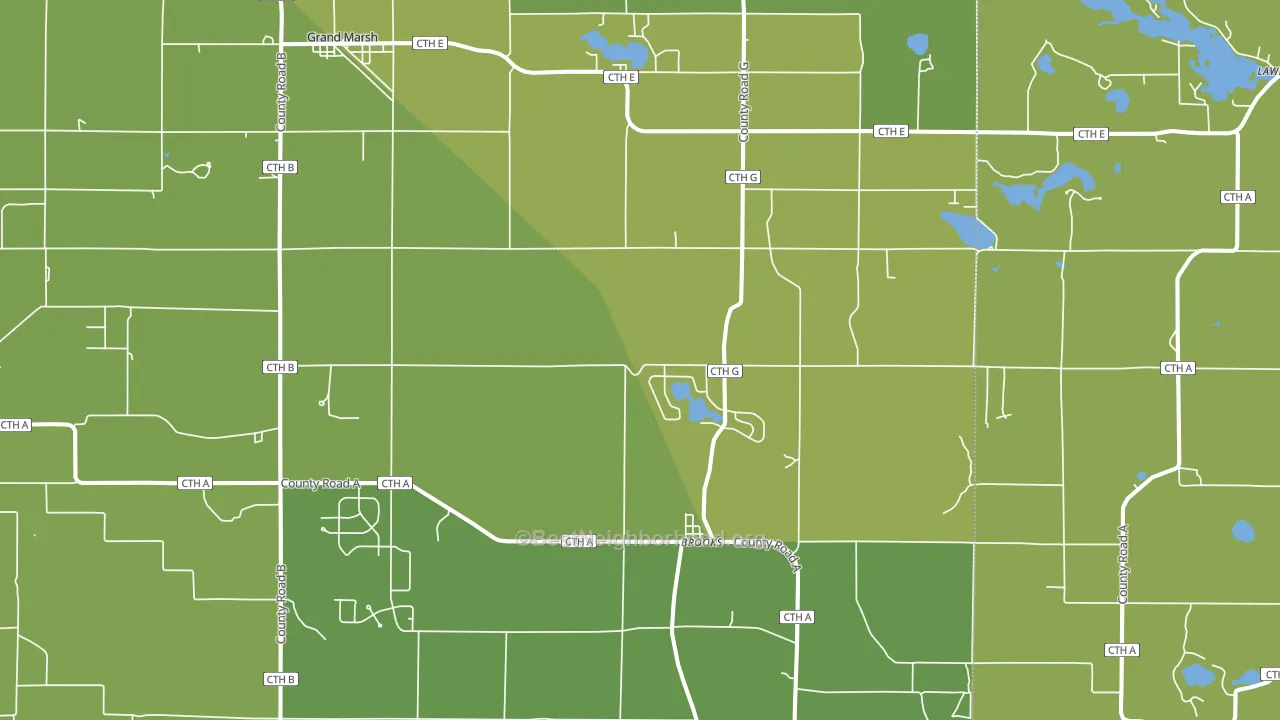
About 66% of adults in Brooks typically vote, near the U.S. average of about 62%. Among adults in Brooks, ~25% vote Democratic, ~41% Republican, and ~34% don't vote. The map below shows estimated turnout by block group.
How Brooks compares
Among cities within 25 miles, Brooks leans more Republican than 4 of 36 neighbors.
Brooks runs about 22 points more Republican than Wisconsin as a whole.
Why Brooks leans the way it does
This analysis examined 14,881 data points per city to find what predicts political lean and turnout. The items below are a few correlations that stood out for Brooks, not a ranked or complete list of what matters most.
Areas with low college attainment vote Republican. About 9% of adults in Brooks hold a bachelor's degree, about 18 points below the Wisconsin average of 26%.
Walkability and Republican lean
Places with a low walkability score tend to lean Republican; Brooks, WI sits below the national average on this measure. A walkable street grid does not change how people vote; it mostly reflects how urban a place is.
Why turnout in Brooks looks the way it does
Homeowners vote more often than renters. About 94% of households in Brooks own their home, about 15 points above the Wisconsin average of 80%. Learn more about the findings and methodology on the political spectrum map.
Nearby Cities
- Grand Marsh, WI R+30
- Oxford, WI R+32
- Lawrence, WI R+36
- Brookside, WI R+31
- Easton, WI R+30
- Westfield, WI R+35
- Adams, WI R+24
- Packwaukee, WI R+37
- Plainville, WI R+30
- White Creek, WI R+36
Cities with Similar Populations
- Clear Lake, WA R+17
- Roachdale, IN R+58
- Monroe North, WA R+8
- Lambert, MS D+63
- Grand Coteau, LA Even
- Woodboro, WI R+25
- Kuhn Station, IL R+34
- Union Hall, VA R+31
- Lyndon, KS R+51
- Cascade, CO D+6
Sources and methodology
Precinct-level voting records used to fit the model come from Wisconsin Elections Commission, distributed by the Voting and Election Science Team. Demographic inputs come from the U.S. Census Bureau (ACS 5-year estimates and the 2020 Decennial Census). Health and environmental inputs come from the CDC (PLACES and the Environmental Justice Index). Land cover comes from the USGS and EPA. Election-day and lead-up weather come from PRISM 4km daily grids and the NOAA Global Historical Climatology Network. Mail-voting and election-administration patterns come from the MIT Election Lab's Survey of the Performance of American Elections. Block-group crime detail comes from CrimeGrade. Internet data and modeling support provided by ISPreports.org.
Modeling and analysis by the BestNeighborhood data science team. Full methodology and findings: political spectrum map.
Methodology reviewed by the BestNeighborhood data team. Last updated May 2026.