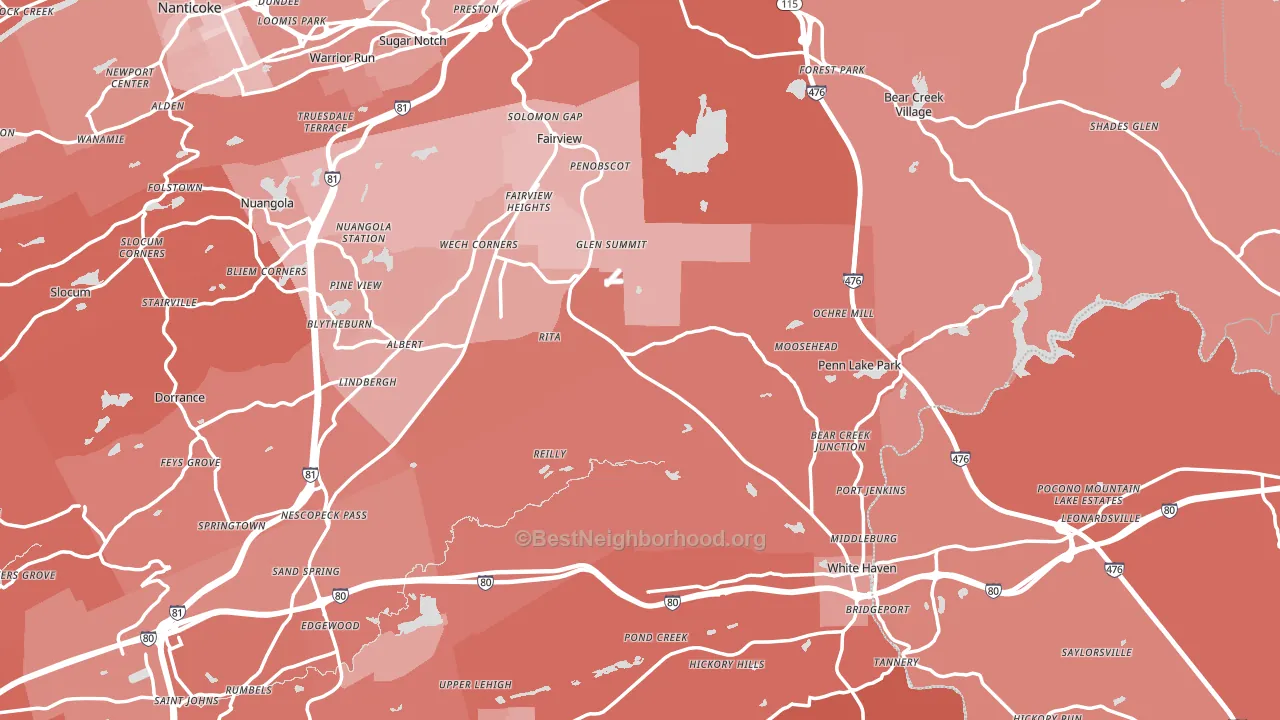
Cambra leans heavily Republican by roughly 42 points: about 29% of voters vote Democratic and 71% Republican.
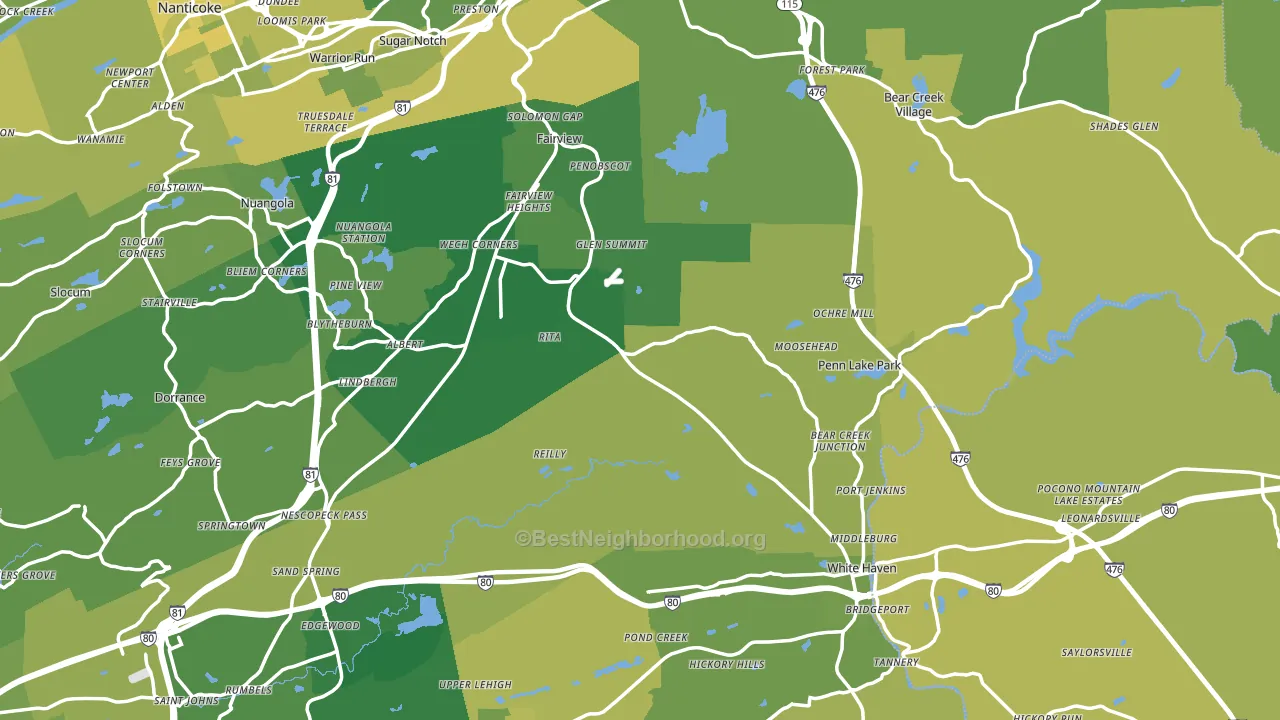
About 66% of adults in Cambra typically vote, near the U.S. average of about 62%. Among adults in Cambra, ~19% vote Democratic, ~47% Republican, and ~34% don't vote. The map below shows estimated turnout by block group.
How Cambra compares
Among cities within 25 miles, Cambra leans more Republican than 123 of 167 neighbors.
Cambra runs about 39 points more Republican than Pennsylvania as a whole.
Politics vary noticeably by neighborhood within Cambra. The northwest side is the most Republican-leaning (R+57) and the northeast side is the least Republican-leaning (R+35), a spread of about 22 points.
Why Cambra leans the way it does
Density, race composition, education, and family structure all sit close to their national averages in Cambra. The lean here lands roughly where demographic data alone would predict.
Paved land cover and Republican lean
Places with little paved surface tend to lean Republican; Cambra, PA sits in the bottom quarter nationally on this measure. Paved ground does not change how people vote; it mostly reflects how urban and built-up a place is.
Why turnout in Cambra looks the way it does
Homeowners vote more often than renters. About 95% of households in Cambra own their home, about 16 points above the Pennsylvania average of 79%. High high-school completion lines up with higher turnout, and about 96% of adults in Cambra have completed high school, above 86% of cities. Learn more about the findings and methodology on the political spectrum map.
Nearby Cities
- Glen Summit, PA R+27
- Penobscot, PA R+21
- Mountain Top, PA R+18
- Penn Lake Park, PA R+39
- White Haven, PA R+35
- Port Jenkins, PA R+35
- East Side, PA R+33
- Bear Creek Village, PA R+36
- Sand Spring, PA R+36
Cities with Similar Populations
- Williams, TX R+79
- Clipper Mills, CA R+27
- Shallmar, MD R+67
- Yaleville, NY R+26
- Unity, AL R+80
- North Bangor, PA R+36
- Galatia, NY R+50
- Gee, KY R+61
- Geyser, MT R+63
- Lone Elm, MO R+62
Sources and methodology
Precinct-level voting records used to fit the model come from Pennsylvania Department of State, Bureau of Elections, distributed by the Voting and Election Science Team. Demographic inputs come from the U.S. Census Bureau (ACS 5-year estimates and the 2020 Decennial Census). Health and environmental inputs come from the CDC (PLACES and the Environmental Justice Index). Land cover comes from the USGS and EPA. Election-day and lead-up weather come from PRISM 4km daily grids and the NOAA Global Historical Climatology Network. Mail-voting and election-administration patterns come from the MIT Election Lab's Survey of the Performance of American Elections. Block-group crime detail comes from CrimeGrade. Internet data and modeling support provided by ISPreports.org.
Modeling and analysis by the BestNeighborhood data science team. Full methodology and findings: political spectrum map.
Methodology reviewed by the BestNeighborhood data team. Last updated May 2026.