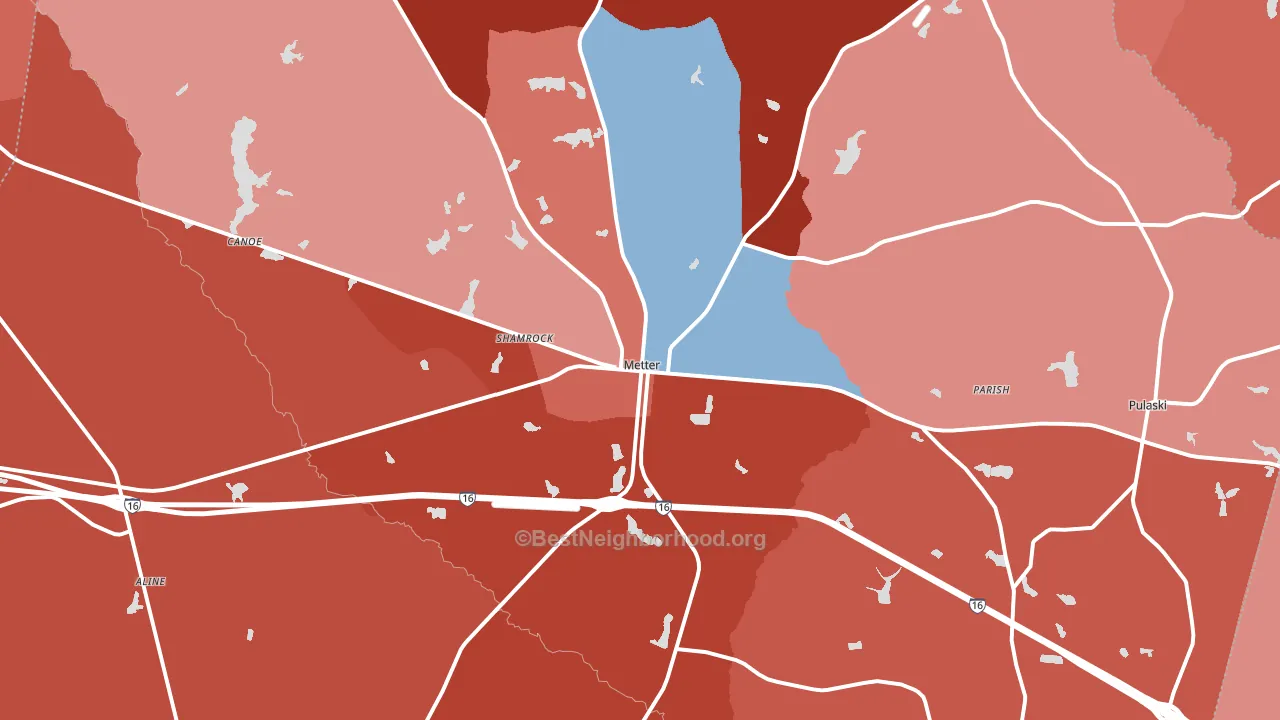
Candler County leans heavily Republican by roughly 40 points: about 30% of voters vote Democratic and 70% Republican.
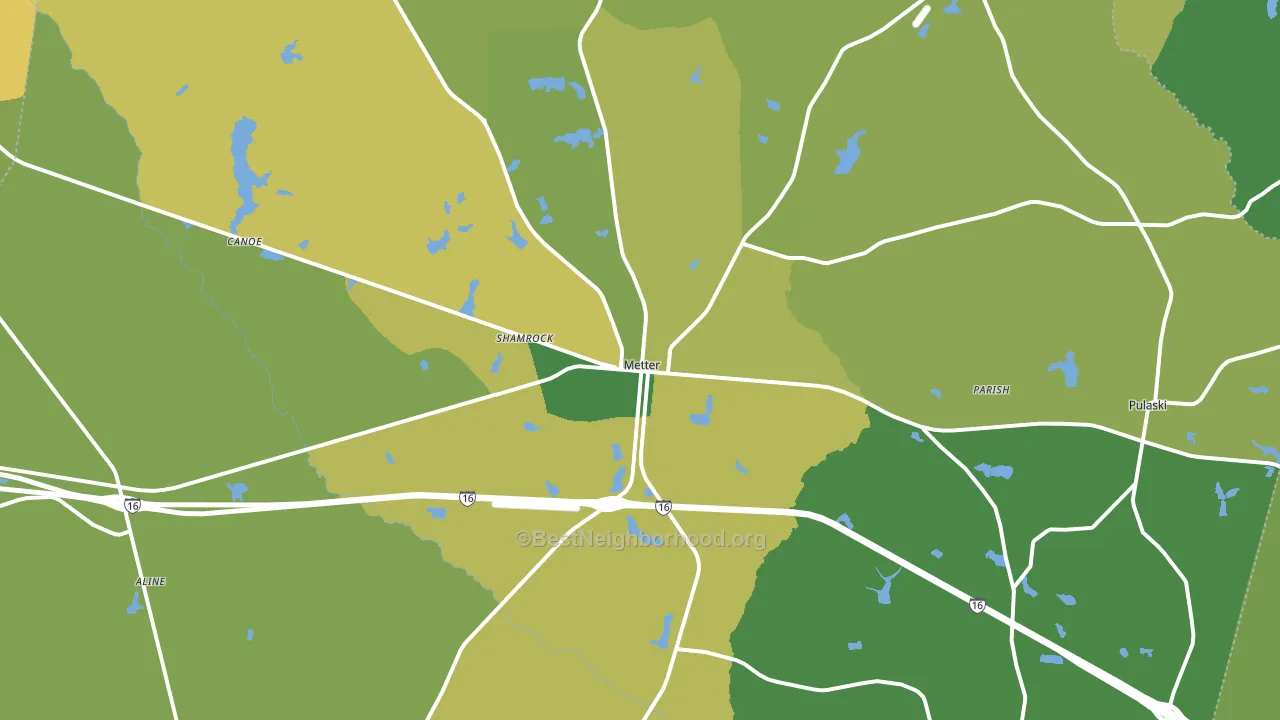
About 70% of adults in Candler County typically vote, above the U.S. average of about 62%. Among adults in Candler County, ~21% vote Democratic, ~49% Republican, and ~30% don't vote. The map below shows estimated turnout by block group.
How Candler County compares
Among counties within 50 miles, Candler County leans more Republican than 12 of 17 neighbors.
Candler County runs about 37 points more Republican than Georgia as a whole.
Politics vary noticeably by city within Candler County. The south side is the most Republican-leaning (R+62) and the north side is the least Republican-leaning (R+16), a spread of about 46 points.
Why Candler County leans the way it does
This analysis examined 14,881 data points per county to find what predicts political lean and turnout. The items below are a few correlations that stood out for Candler County, not a ranked or complete list of what matters most.
Rural areas vote Republican. About 13% of residents in Candler County live in densely developed areas, about 13 points below the Georgia average of 26%.
Walkability and Republican lean
Places with a low walkability score tend to lean Republican; Candler County, GA sits in the bottom quarter nationally on this measure. A walkable street grid does not change how people vote; it mostly reflects how urban a place is.
Why turnout in Candler County looks the way it does
Areas with limited routine healthcare access turn out at lower rates. Candler County is in the bottom quarter nationally for routine-care measures such as insurance coverage, preventive screenings, and dental visits. Learn more about the findings and methodology on the political spectrum map.
Nearby Counties
- Bulloch County, GA R+10
- Evans County, GA R+33
- Emanuel County, GA R+35
- Toombs County, GA R+34
- Tattnall County, GA R+43
- Jenkins County, GA R+20
- Treutlen County, GA R+35
- Montgomery County, GA R+47
- Screven County, GA R+23
- Johnson County, GA R+39
Counties with Similar Populations
- Grant County, WV R+74
- McIntosh County, GA R+24
- Wayne County, MO R+68
- Washington County, NC D+7
- DeKalb County, MO R+57
- North Slope Borough, AK D+12
- Noble County, OK R+54
- Washita County, OK R+74
- St. Helena Parish, LA D+7
- Lancaster County, VA R+9
Sources and methodology
Precinct-level voting records used to fit the model come from Georgia Elections Division, distributed by the Voting and Election Science Team. Demographic inputs come from the U.S. Census Bureau (ACS 5-year estimates and the 2020 Decennial Census). Health and environmental inputs come from the CDC (PLACES and the Environmental Justice Index). Land cover comes from the USGS and EPA. Election-day and lead-up weather come from PRISM 4km daily grids and the NOAA Global Historical Climatology Network. Mail-voting and election-administration patterns come from the MIT Election Lab's Survey of the Performance of American Elections. Block-group crime detail comes from CrimeGrade. Internet data and modeling support provided by ISPreports.org.
Modeling and analysis by the BestNeighborhood data science team. Full methodology and findings: political spectrum map.
Methodology reviewed by the BestNeighborhood data team. Last updated May 2026.