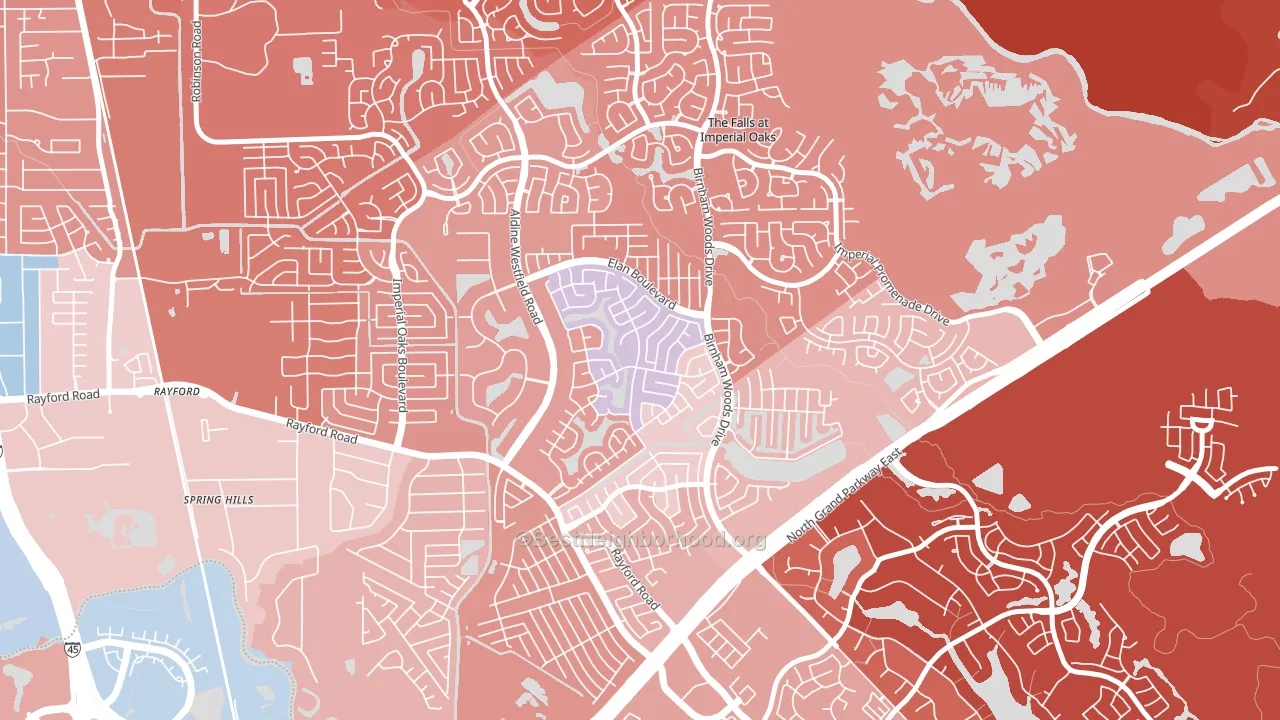
Canyon Lakes at Legends Ranch leans slightly Republican by roughly 14 points: about 43% of voters vote Democratic and 57% Republican.
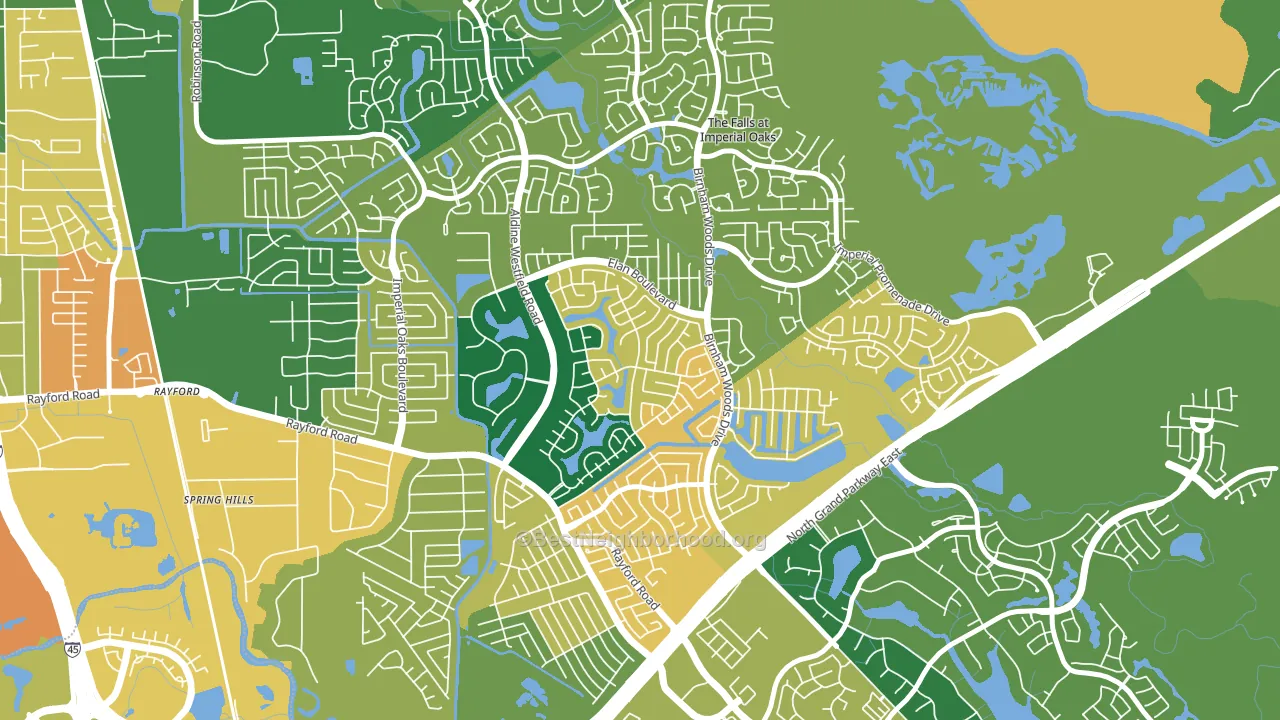
About 72% of adults in Canyon Lakes at Legends Ranch typically vote, above the U.S. average of about 62%. Among adults in Canyon Lakes at Legends Ranch, ~31% vote Democratic, ~41% Republican, and ~28% don't vote. The map below shows estimated turnout by block group.
How Canyon Lakes at Legends Ranch compares
Canyon Lakes at Legends Ranch sits in a sparsely populated area with few comparable neighborhoods nearby.
Politically, Canyon Lakes at Legends Ranch sits close to the rest of Texas.
Politics vary noticeably by block within Canyon Lakes at Legends Ranch. The northeast side is the most Republican-leaning (R+22) and the southeast side is the least Republican-leaning (R+6), a spread of about 16 points.
Why Canyon Lakes at Legends Ranch leans the way it does
This analysis examined 14,881 data points per neighborhood to find what predicts political lean and turnout. The items below are a few correlations that stood out for Canyon Lakes at Legends Ranch, not a ranked or complete list of what matters most.
Areas with many family households vote Republican. About 77% of households in Canyon Lakes at Legends Ranch are family households, about 11 points above the U.S. average of 67%.
Walkability and Republican lean
Places with a low walkability score tend to lean Republican; Canyon Lakes at Legends Ranch, Spring, TX sits in the bottom tenth nationally on this measure. A walkable street grid does not change how people vote; it mostly reflects how urban a place is.
Why turnout in Canyon Lakes at Legends Ranch looks the way it does
Homeowners vote more often than renters. About 94% of households in Canyon Lakes at Legends Ranch own their home, about 20 points above the Texas average of 75%. Learn more about the findings and methodology on the political spectrum map.
Nearby Neighborhoods
- Imperial Oaks, Spring, TX R+32
- Grogan's Mill, The Woodlands, TX R+8
- Riverwalk, Porter, TX R+16
- Panther Creek, The Woodlands, TX R+22
- Harper's Landing, Conroe, TX R+28
- North Park Forest, Houston, TX D+46
- Cypress Station, Houston, TX D+59
- Cypresswood, Spring, TX R+19
- Cochran's Crossing, The Woodlands, TX R+27
- Creekside Park, The Woodlands, TX R+23
Neighborhoods with Similar Populations
- North Rosedale Park, Detroit, MI D+86
- Bethany, Lincoln, NE D+10
- Hamey Heights, Vancouver, WA D+32
- Adams Farm, Greensboro, NC D+41
- Filbert-Winesap, Bothell West, WA D+18
- Bixby Knolls, Long Beach, CA D+46
- Holiday Park, St. Petersburg, FL R+8
- Royal Land, Coral Springs, FL D+22
- Mid-Town Belvedere, Baltimore, MD D+80
- Downtown Fremont Historic District, Fremont, OH R+4
Sources and methodology
Precinct-level voting records used to fit the model come from Texas Secretary of State, Elections Division, distributed by the Voting and Election Science Team. Demographic inputs come from the U.S. Census Bureau (ACS 5-year estimates and the 2020 Decennial Census). Health and environmental inputs come from the CDC (PLACES and the Environmental Justice Index). Land cover comes from the USGS and EPA. Election-day and lead-up weather come from PRISM 4km daily grids and the NOAA Global Historical Climatology Network. Mail-voting and election-administration patterns come from the MIT Election Lab's Survey of the Performance of American Elections. Block-group crime detail comes from CrimeGrade. Internet data and modeling support provided by ISPreports.org.
Modeling and analysis by the BestNeighborhood data science team. Full methodology and findings: political spectrum map.
Methodology reviewed by the BestNeighborhood data team. Last updated May 2026.