Centenary leans Democratic by roughly 16 points: about 58% of voters vote Democratic and 42% Republican.
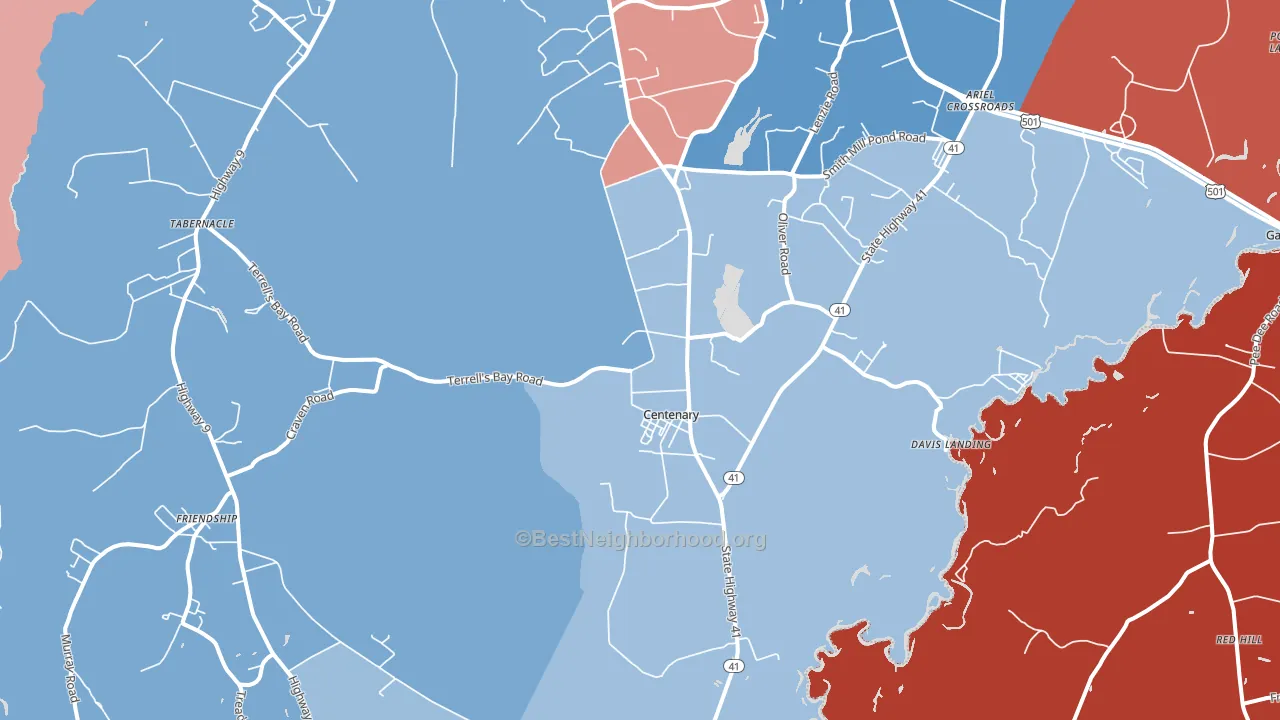
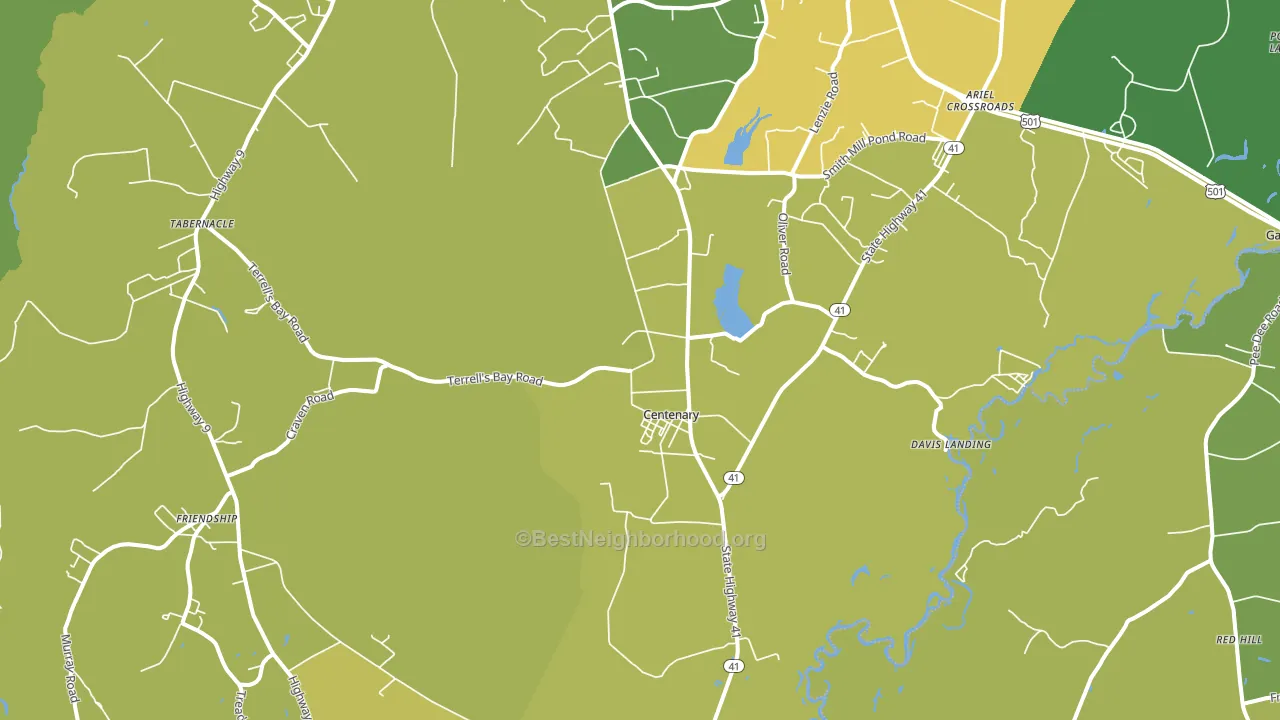
About 64% of adults in Centenary typically vote, near the U.S. average of about 62%. Among adults in Centenary, ~37% vote Democratic, ~27% Republican, and ~36% don't vote. The map below shows estimated turnout by block group.
How Centenary compares
Among cities within 25 miles, Centenary leans more Democratic than 36 of 40 neighbors.
Centenary runs about 35 points more Democratic than South Carolina as a whole. South Carolina leans Republican overall, while Centenary is one of the few Democratic-leaning pockets.
Politics vary noticeably by neighborhood within Centenary. The northwest side is the most Democratic-leaning (D+24) and the southeast side is the least Democratic-leaning (D+11), a spread of about 13 points.
Why Centenary leans the way it does
This analysis examined 14,881 data points per city to find what predicts political lean and turnout. The items below are a few correlations that stood out for Centenary, not a ranked or complete list of what matters most.
Centenary votes against the grain of South Carolina. South Carolina leans Republican overall, while Centenary runs about 35 points more Democratic. A high never-married share predicts Democratic voting, and about 38% of adults in Centenary have never been married, above 91% of cities.
Park access and Republican lean
Places with low park coverage tend to lean Republican; Centenary, SC sits in the bottom tenth nationally on this measure. Park access does not change how people vote; it tends to track denser, higher-income areas.
Why turnout in Centenary looks the way it does
Limited routine healthcare access lines up with lower turnout, and Centenary sits in the bottom quarter on routine-care measures. Learn more about the findings and methodology on the political spectrum map.
Nearby Cities
- Eulonia, SC D+23
- Rains, SC D+20
- Gresham, SC R+5
- Marion, SC D+26
- Galivants Ferry, SC R+69
- Gapway, SC R+39
- Blue Brick, SC D+6
- Mullins, SC D+14
- Cool Spring, SC R+72
- Pamplico, SC R+28
Cities with Similar Populations
- Fort Green Springs, FL R+62
- Fourche, AR R+57
- Wolfs Corner, PA R+56
- Hollis Crossroads, AL R+81
- Crowheart, WY R+8
- Straightstone, VA R+18
- Grant, NY R+24
- Linn, OK R+63
- Lequire, OK R+75
- Millers Ferry, AL R+42
Sources and methodology
Precinct-level voting records used to fit the model come from South Carolina State Election Commission, distributed by the Voting and Election Science Team. Demographic inputs come from the U.S. Census Bureau (ACS 5-year estimates and the 2020 Decennial Census). Health and environmental inputs come from the CDC (PLACES and the Environmental Justice Index). Land cover comes from the USGS and EPA. Election-day and lead-up weather come from PRISM 4km daily grids and the NOAA Global Historical Climatology Network. Mail-voting and election-administration patterns come from the MIT Election Lab's Survey of the Performance of American Elections. Block-group crime detail comes from CrimeGrade. Internet data and modeling support provided by ISPreports.org.
Modeling and analysis by the BestNeighborhood data science team. Full methodology and findings: political spectrum map.
Methodology reviewed by the BestNeighborhood data team. Last updated May 2026.