Chacon leans Democratic by roughly 22 points: about 61% of voters vote Democratic and 39% Republican.
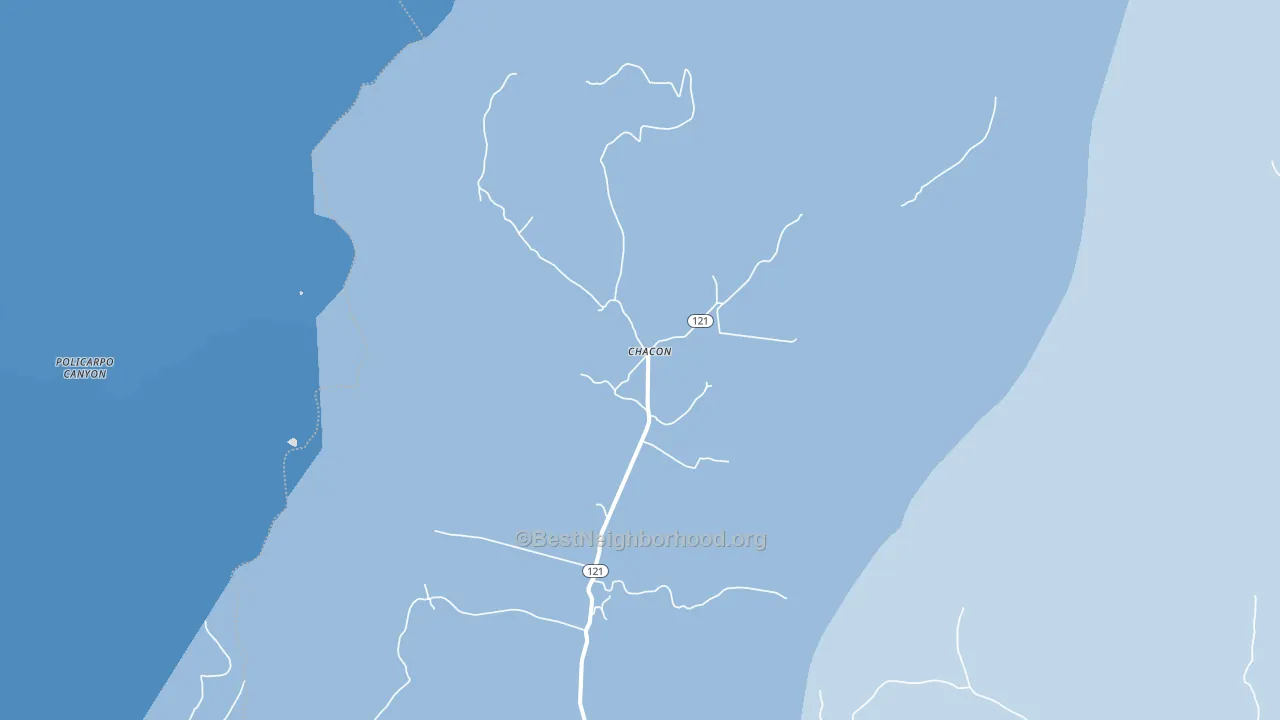
About 81% of adults in Chacon typically vote, above the U.S. average of about 62%. Among adults in Chacon, ~49% vote Democratic, ~32% Republican, and ~19% don't vote. The map below shows estimated turnout by block group.
How Chacon compares
Among cities within 25 miles, Chacon leans more Democratic than 21 of 43 neighbors.
Chacon runs about 15 points more Democratic than New Mexico as a whole.
Why Chacon leans the way it does
Density, race composition, education, and family structure all sit close to their national averages in Chacon. The lean here lands roughly where demographic data alone would predict.
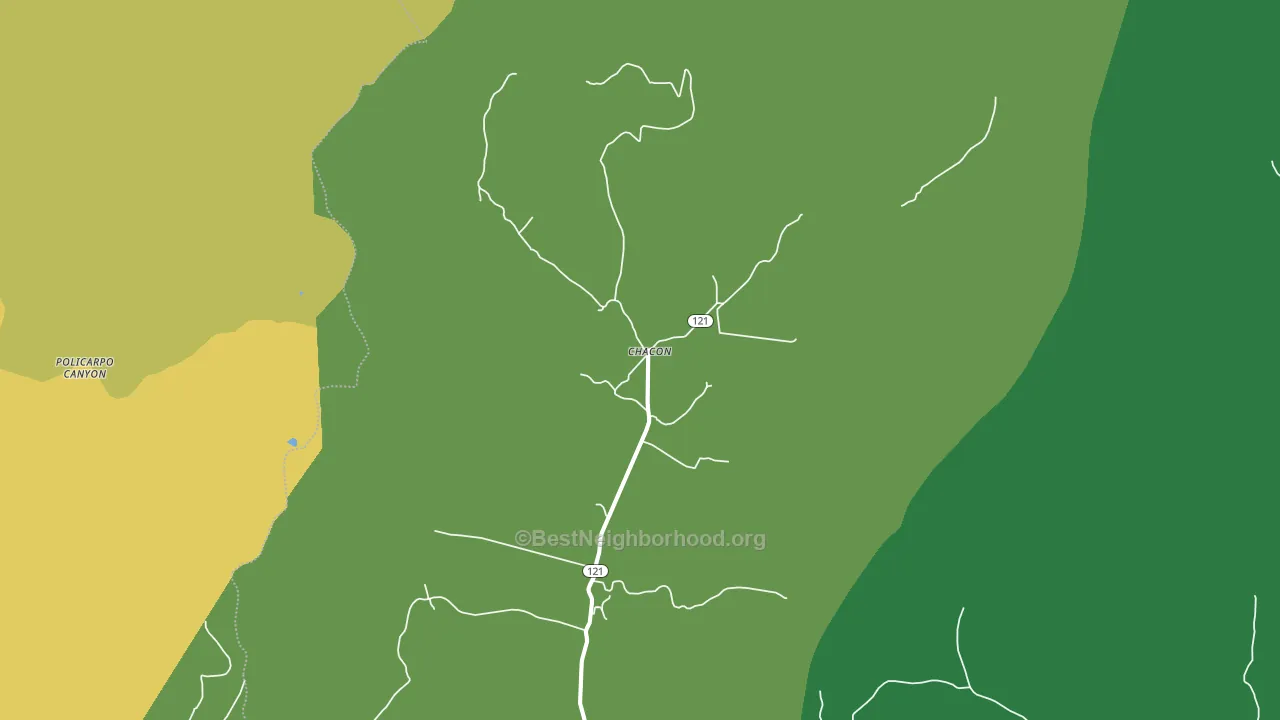
Never-married share, developed land, and voter turnout
Places that combine a low never-married share and a rural land-use pattern tend to turn out at a higher rate, as Chacon, NM does.
Why turnout in Chacon looks the way it does
Areas with high high-school completion turn out at higher rates. About 98% of adults in Chacon have completed high school, about 11 points above the New Mexico average of 87%. Limited routine healthcare access lines up with lower turnout, and Chacon sits in the bottom quarter on routine-care measures. Homeowners vote more often than renters, and about 91% of households in Chacon own their home, about 16 points above the U.S. average of 75%. Learn more about the findings and methodology on the political spectrum map.
Nearby Cities
- Holman, NM D+19
- Guadalupita, NM D+7
- Cleveland, NM D+21
- Mora, NM D+26
- Lake View Pines, NM R+9
- Monte Aplanado, NM D+25
- Los Hueros, NM D+10
- Idlewild, NM R+9
Cities with Similar Populations
- Spring Creek, VA R+66
- North Lowell, WI R+44
- West Hawley, MA D+11
- Westbend, KY R+60
- Post Lake, WI R+32
- Roystone, PA R+52
- Dale, IA R+41
- Pottsville, TX R+77
- Northway, AK R+9
- Woodruff, ID R+82
Sources and methodology
Precinct-level voting records used to fit the model come from New Mexico Secretary of State, Bureau of Elections, distributed by the Voting and Election Science Team. Demographic inputs come from the U.S. Census Bureau (ACS 5-year estimates and the 2020 Decennial Census). Health and environmental inputs come from the CDC (PLACES and the Environmental Justice Index). Land cover comes from the USGS and EPA. Election-day and lead-up weather come from PRISM 4km daily grids and the NOAA Global Historical Climatology Network. Mail-voting and election-administration patterns come from the MIT Election Lab's Survey of the Performance of American Elections. Block-group crime detail comes from CrimeGrade. Internet data and modeling support provided by ISPreports.org.
Modeling and analysis by the BestNeighborhood data science team. Full methodology and findings: political spectrum map.
Methodology reviewed by the BestNeighborhood data team. Last updated May 2026.