Crenshaw is a Democratic stronghold. About 87% of voters here vote Democratic and 13% Republican.
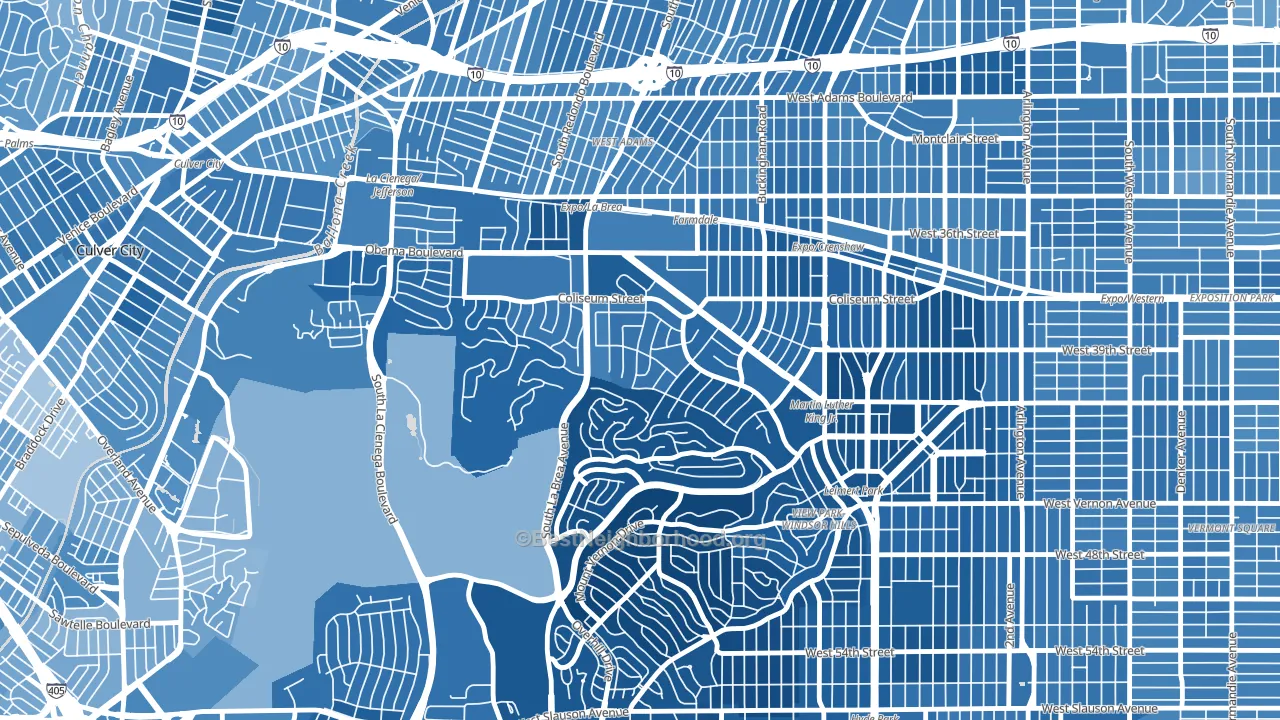
About 53% of adults in Crenshaw typically vote, below the U.S. average of about 62%. Among adults in Crenshaw, ~46% vote Democratic, ~7% Republican, and ~47% don't vote. The map below shows estimated turnout by block group.
How Crenshaw compares
Among neighborhoods within 5 miles, Crenshaw leans more Democratic than 18 of 21 neighbors.
Crenshaw runs about 53 points more Democratic than California as a whole.
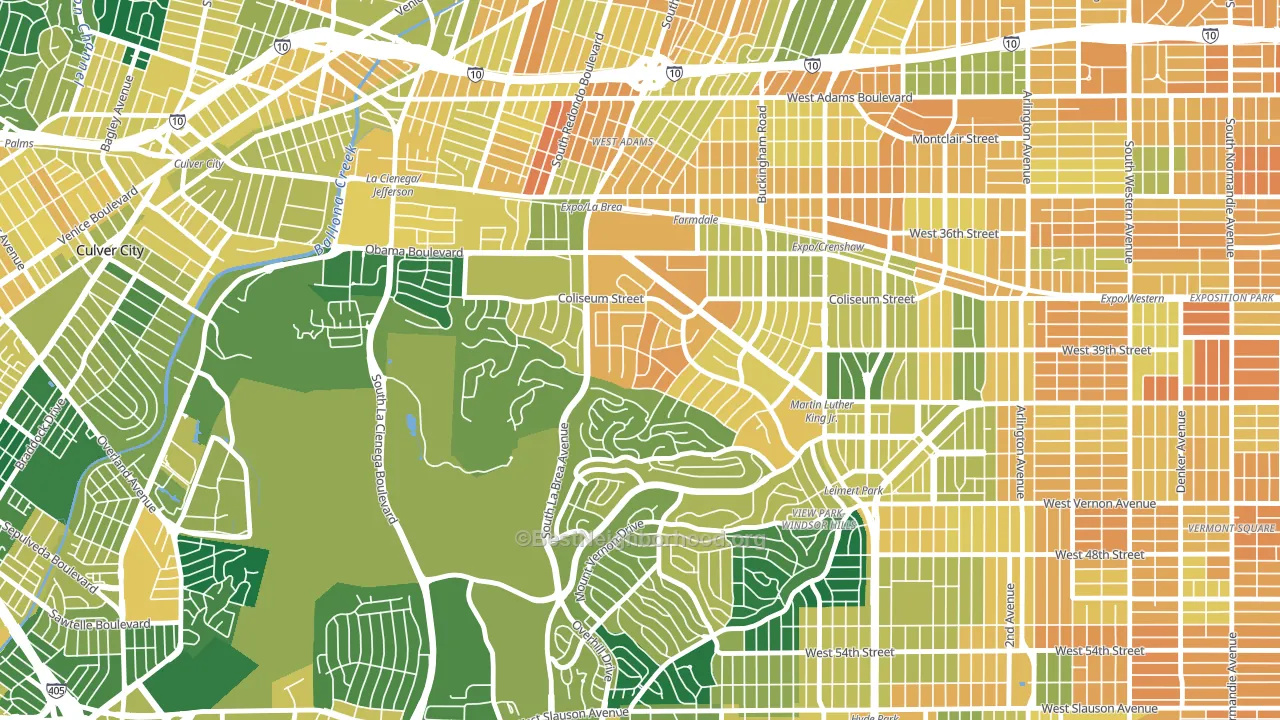
Politics vary noticeably by block within Crenshaw. The southwest side is the most Democratic-leaning (D+84) and the east side is the least Democratic-leaning (D+63), a spread of about 21 points.
Why Crenshaw leans the way it does
This analysis examined 14,881 data points per neighborhood to find what predicts political lean and turnout. The items below are a few correlations that stood out for Crenshaw, not a ranked or complete list of what matters most.
Areas with many never-married adults vote Democratic. About 47% of adults in Crenshaw have never been married, modestly above similar-sized neighborhoods (around 42%).
Population density and Democratic lean
Places with high population density tend to lean Democratic; Crenshaw, Los Angeles, CA sits in the top tenth nationally on this measure.
Why turnout in Crenshaw looks the way it does
Renters vote less often than owners. About 69% of households in Crenshaw rent, about 44 points above the U.S. average of 25%. Crowded housing lines up with lower turnout, and about 10% of homes in Crenshaw have more than one occupant per room, above 91% of neighborhoods. High-crime urban areas turn out at lower rates, and Crenshaw sits in the top 15% on a violent-crime measure. Learn more about the findings and methodology on the political spectrum map.
Nearby Neighborhoods
- West Adams, Los Angeles, CA D+61
- Leimert Park, Los Angeles, CA D+78
- Windsor Hills, View Park-Windsor Hills, CA D+84
- Jefferson Park, Los Angeles, CA D+59
- Hyde Park, Los Angeles, CA D+70
- Jefferson, Culver City, CA D+59
- Mid City, Los Angeles, CA D+52
- Pico-Robertson, Los Angeles, CA D+59
- Fox Hills, Culver City, CA D+54
- Palms, Los Angeles, CA D+56
Neighborhoods with Similar Populations
- Pacific Beach, San Diego, CA D+35
- Mariners Harbor, Staten Island, NY D+24
- Pennsport-Whitman-Queen, Philadelphia, PA D+42
- Stapleton, Denver, CO D+56
- West Bloomington, Bloomington, MN D+33
- South End, Boston, MA D+64
- Pottage Park, Chicago, IL D+26
- Eagle Ford, Dallas, TX D+47
- Wissanoning, Philadelphia, PA D+30
- South Central Omaha, Omaha, NE D+15
Sources and methodology
Precinct-level voting records used to fit the model come from California Secretary of State, Elections, distributed by the Voting and Election Science Team. Demographic inputs come from the U.S. Census Bureau (ACS 5-year estimates and the 2020 Decennial Census). Health and environmental inputs come from the CDC (PLACES and the Environmental Justice Index). Land cover comes from the USGS and EPA. Election-day and lead-up weather come from PRISM 4km daily grids and the NOAA Global Historical Climatology Network. Mail-voting and election-administration patterns come from the MIT Election Lab's Survey of the Performance of American Elections. Block-group crime detail comes from CrimeGrade. Internet data and modeling support provided by ISPreports.org.
Modeling and analysis by the BestNeighborhood data science team. Full methodology and findings: political spectrum map.
Methodology reviewed by the BestNeighborhood data team. Last updated May 2026.