Custer County leans heavily Republican by roughly 44 points: about 28% of voters vote Democratic and 72% Republican.
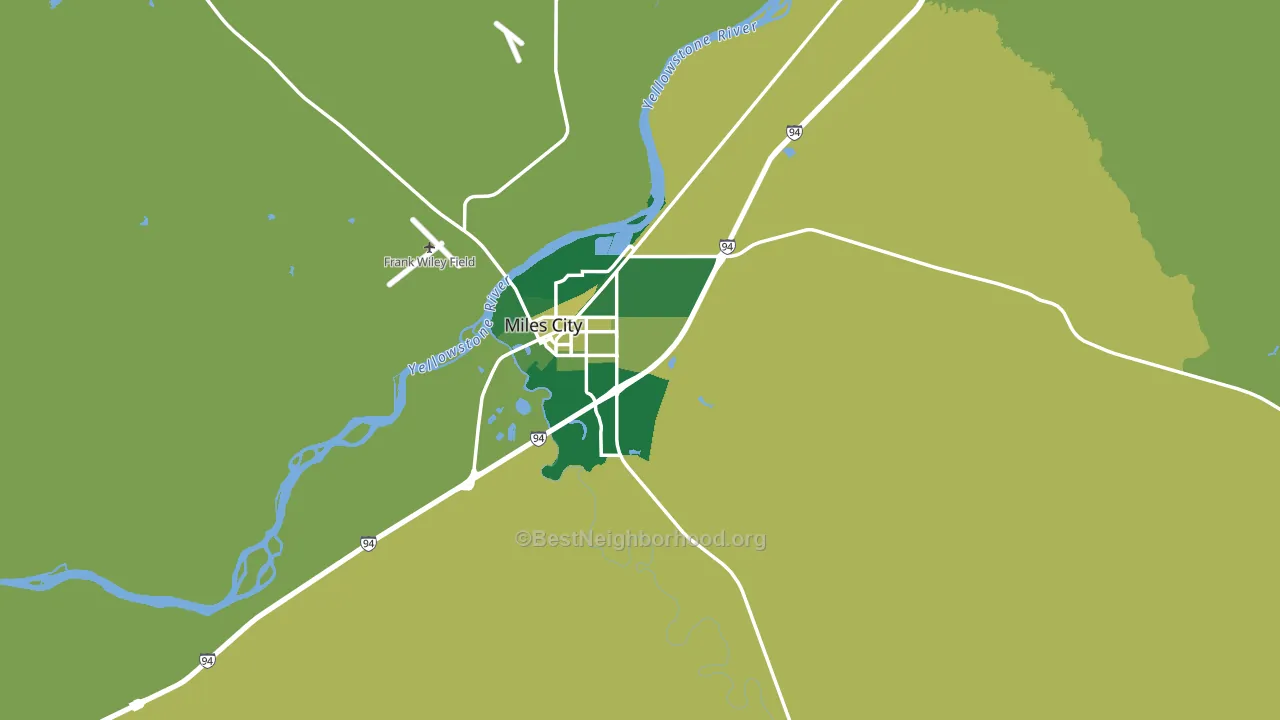
About 82% of adults in Custer County typically vote, above the U.S. average of about 62%. Among adults in Custer County, ~23% vote Democratic, ~59% Republican, and ~18% don't vote. The map below shows estimated turnout by block group.
How Custer County compares
Custer County runs about 23 points more Republican than Montana as a whole.
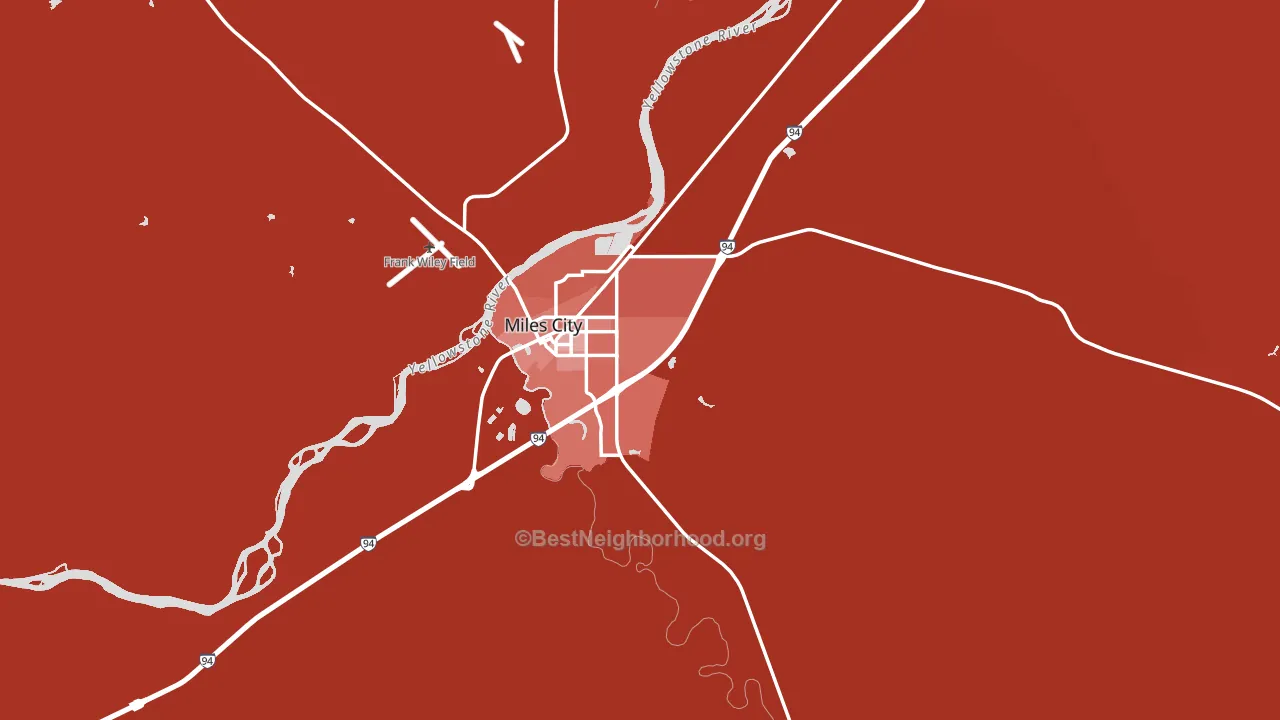
Politics vary noticeably by city within Custer County. The southwest side is the most Republican-leaning (R+84) and the west side is the least Republican-leaning (R+33), a spread of about 52 points.
Why Custer County leans the way it does
This analysis examined 14,881 data points per county to find what predicts political lean and turnout. The items below are a few correlations that stood out for Custer County, not a ranked or complete list of what matters most.
Custer County votes Republican even though it is densely developed (about 63%, far above the Montana average of 13%). State and regional patterns outweigh the Democratic lean that density usually predicts here.
High-school completion and voter turnout
Places with high-school-completion-heavy adults tend to turn out at a higher rate; Custer County, MT sits in the top tenth nationally on this measure.
Why turnout in Custer County looks the way it does
Areas with high high-school completion turn out at higher rates. About 96% of adults in Custer County have completed high school, about 6 points above the U.S. average of 90%. Learn more about the findings and methodology on the political spectrum map.
Nearby Counties
- Prairie County, MT R+68
- Rosebud County, MT R+20
- Powder River County, MT R+72
- Treasure County, MT R+66
- Fallon County, MT R+71
- Dawson County, MT R+55
- Carter County, MT R+78
- McCone County, MT R+72
- Garfield County, MT R+87
- Wibaux County, MT R+75
Counties with Similar Populations
- Linn County, MO R+55
- Northumberland County, VA R+19
- Terry County, TX R+49
- Marion County, KS R+52
- Owyhee County, ID R+63
- Lyon County, IA R+65
- Lunenburg County, VA R+24
- Juab County, UT R+71
- Summers County, WV R+52
- Morris County, TX R+39
Sources and methodology
Precinct-level voting records used to fit the model come from Montana Secretary of State, Elections, distributed by the Voting and Election Science Team. Demographic inputs come from the U.S. Census Bureau (ACS 5-year estimates and the 2020 Decennial Census). Health and environmental inputs come from the CDC (PLACES and the Environmental Justice Index). Land cover comes from the USGS and EPA. Election-day and lead-up weather come from PRISM 4km daily grids and the NOAA Global Historical Climatology Network. Mail-voting and election-administration patterns come from the MIT Election Lab's Survey of the Performance of American Elections. Block-group crime detail comes from CrimeGrade. Internet data and modeling support provided by ISPreports.org.
Modeling and analysis by the BestNeighborhood data science team. Full methodology and findings: political spectrum map.
Methodology reviewed by the BestNeighborhood data team. Last updated May 2026.