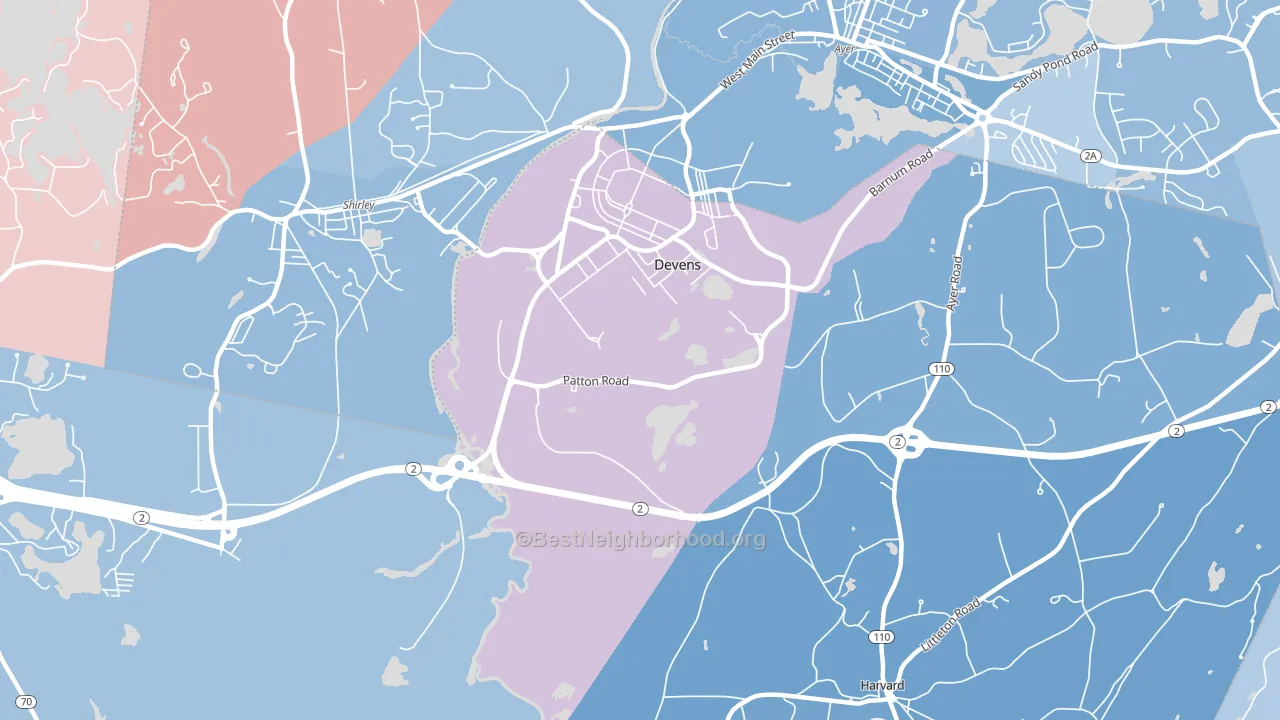
Devens leans slightly Democratic by roughly 6 points: about 53% of voters vote Democratic and 47% Republican.
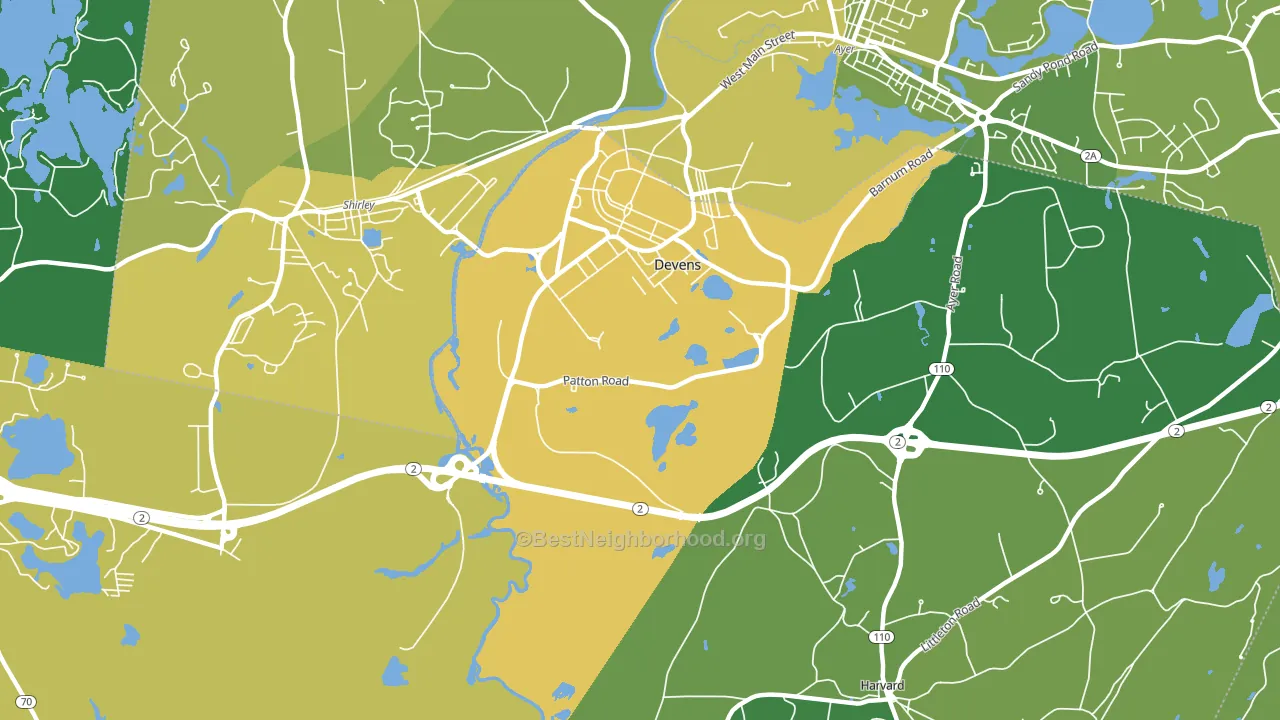
About 56% of adults in Devens typically vote, below the U.S. average of about 62%. Among adults in Devens, ~30% vote Democratic, ~26% Republican, and ~44% don't vote. The map below shows estimated turnout by block group.
How Devens compares
Among cities within 25 miles, Devens leans more Democratic than 50 of 138 neighbors.
Devens runs about 18 points more Republican than Massachusetts as a whole.
Politics vary noticeably by neighborhood within Devens. The northeast side is the most Democratic-leaning (D+22) and the west side is the least Democratic-leaning (D+4), a spread of about 18 points.
Why Devens leans the way it does
This analysis examined 14,881 data points per city to find what predicts political lean and turnout. The items below are a few correlations that stood out for Devens, not a ranked or complete list of what matters most.
Dense areas vote Democratic. About 52% of residents in Devens live in densely developed areas, about 16 points above the U.S. average of 36%. A high never-married share predicts Democratic voting, and about 54% of adults in Devens have never been married, in the top fraction of cities.
High-school completion, developed land, and voter turnout
Places that combine low high-school-completion share and a heavily developed built environment tend to turn out at a lower rate, as Devens, MA does.
Why turnout in Devens looks the way it does
Areas with low high-school completion turn out at lower rates. About 76% of adults in Devens have completed high school, about 14 points below the U.S. average of 90%. Renters vote less often than owners, and about 29% of households in Devens rent, above 83% of cities. Learn more about the findings and methodology on the political spectrum map.
Nearby Cities
- Harvard Station, MA D+29
- Shirley, MA D+12
- Still River, MA D+34
- Harvard, MA D+28
- Ayer, MA D+20
- Shirley Center, MA D+9
- Ponakin Mill, MA D+16
- Boxborough, MA D+26
- South Bolton, MA D+31
- Groton, MA D+23
Cities with Similar Populations
- Troy, KS R+59
- Fort Davis, TX R+51
- Allen, MI R+49
- New Berlin, PA R+48
- Lake Waccamaw, NC R+43
- Pearce, AZ R+41
- Karns City, PA R+60
- Lumber City, GA R+31
- Wright-Patterson AFB, OH R+4
- Dent, MN R+32
Sources and methodology
Precinct-level voting records used to fit the model come from Massachusetts Secretary of the Commonwealth, Elections, distributed by the Voting and Election Science Team. Demographic inputs come from the U.S. Census Bureau (ACS 5-year estimates and the 2020 Decennial Census). Health and environmental inputs come from the CDC (PLACES and the Environmental Justice Index). Land cover comes from the USGS and EPA. Election-day and lead-up weather come from PRISM 4km daily grids and the NOAA Global Historical Climatology Network. Mail-voting and election-administration patterns come from the MIT Election Lab's Survey of the Performance of American Elections. Block-group crime detail comes from CrimeGrade. Internet data and modeling support provided by ISPreports.org.
Modeling and analysis by the BestNeighborhood data science team. Full methodology and findings: political spectrum map.
Methodology reviewed by the BestNeighborhood data team. Last updated May 2026.