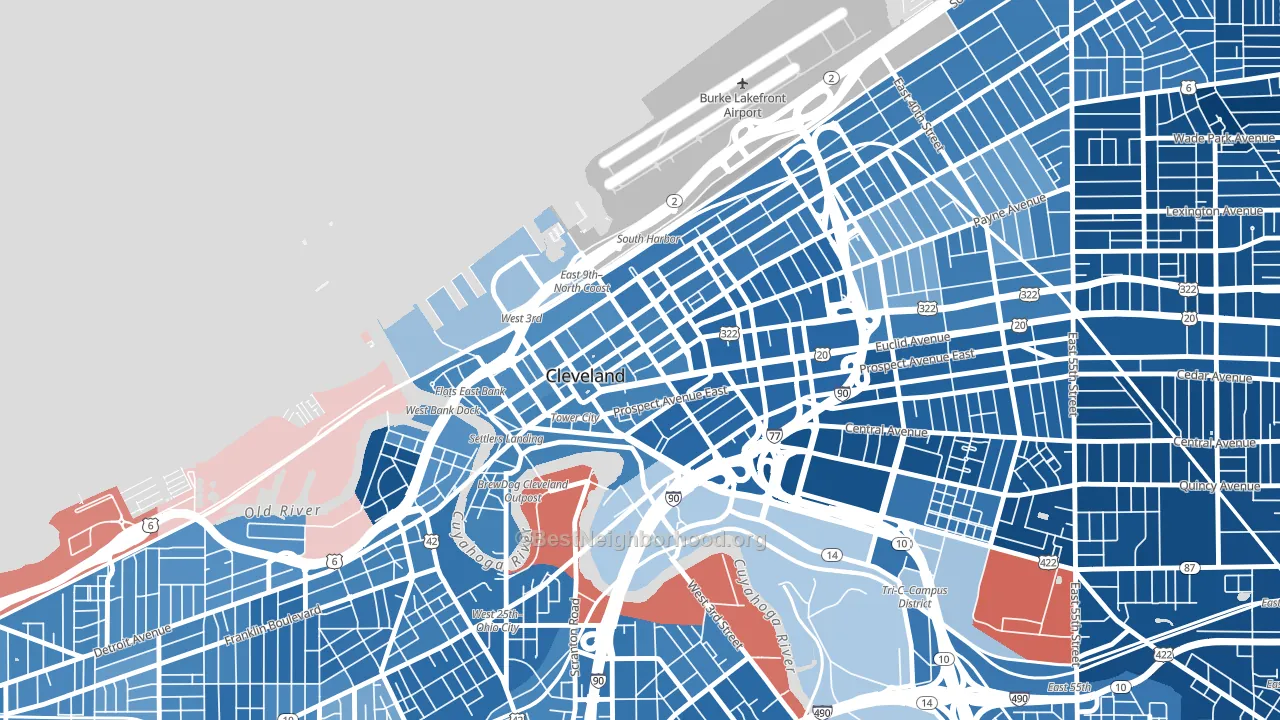
Downtown Cleveland is a Democratic stronghold. About 79% of voters here vote Democratic and 21% Republican.
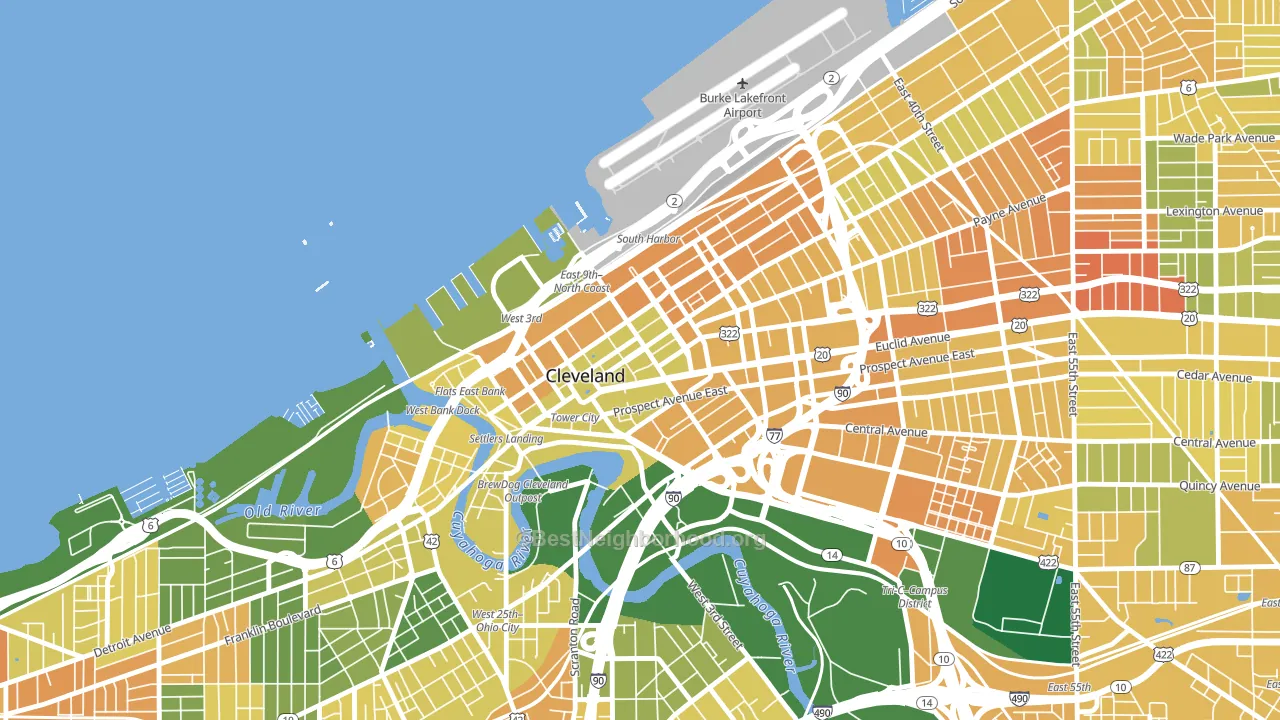
About 42% of adults in Downtown Cleveland typically vote, below the U.S. average of about 62%. Among adults in Downtown Cleveland, ~33% vote Democratic, ~9% Republican, and ~58% don't vote. The map below shows estimated turnout by block group.
How Downtown Cleveland compares
Among neighborhoods within 5 miles, Downtown Cleveland leans more Democratic than 12 of 22 neighbors.
Downtown Cleveland runs about 69 points more Democratic than Ohio as a whole. Ohio leans Republican overall, while Downtown Cleveland is one of the few Democratic-leaning pockets.
Politics vary noticeably by block within Downtown Cleveland. The southeast side is the most Democratic-leaning (D+86) and the northwest side is the least Democratic-leaning (D+27), a spread of about 59 points.
Why Downtown Cleveland leans the way it does
This analysis examined 14,881 data points per neighborhood to find what predicts political lean and turnout. The items below are a few correlations that stood out for Downtown Cleveland, not a ranked or complete list of what matters most.
Downtown Cleveland votes against the grain of Ohio. Ohio leans Republican overall, while Downtown Cleveland runs about 69 points more Democratic. High college attainment predicts Democratic voting, and Downtown Cleveland sits in the top quarter (about 56%, above 77% of neighborhoods). A high never-married share predicts Democratic voting, and about 74% of adults in Downtown Cleveland have never been married, above 98% of neighborhoods.
Population density and Democratic lean
Places with high population density tend to lean Democratic; Downtown Cleveland, Cleveland, OH sits in the top tenth nationally on this measure.
Why turnout in Downtown Cleveland looks the way it does
Renters vote less often than owners. About 92% of households in Downtown Cleveland rent, about 68 points above the U.S. average of 25%. High-crime urban areas turn out at lower rates, and Downtown Cleveland sits in the top 15% on a violent-crime measure. Learn more about the findings and methodology on the political spectrum map.
Nearby Neighborhoods
- Ohio City-West Side, Cleveland, OH D+59
- Central, Cleveland, OH D+78
- Goodrich-Kirtland Park, Cleveland, OH D+45
- Tremont, Cleveland, OH D+55
- Detroit Shoreway, Cleveland, OH D+50
- Clark-Fulton, Cleveland, OH D+30
- Saint Claire-Superior, Cleveland, OH D+76
- North Broadway, Cleveland, OH D+55
- Hough, Cleveland, OH D+85
- Fairfax, Cleveland, OH D+87
Neighborhoods with Similar Populations
- Sugerloaf, San Mateo, CA D+50
- Forest Glen, Chicago, IL D+25
- Black Forest, Colorado Springs, CO R+34
- Buckeye-Shaker, Cleveland, OH D+83
- Colorado University, Boulder, CO D+62
- Dilworth, Charlotte, NC D+34
- Jamestown, Hephzibah, GA D+71
- Eastmoor, Columbus, OH D+56
- Beechfielf-Irvington Area, Baltimore, MD D+83
- North Hill, Spokane, WA D+10
Sources and methodology
Precinct-level voting records used to fit the model come from Ohio Secretary of State, Elections, distributed by the Voting and Election Science Team. Demographic inputs come from the U.S. Census Bureau (ACS 5-year estimates and the 2020 Decennial Census). Health and environmental inputs come from the CDC (PLACES and the Environmental Justice Index). Land cover comes from the USGS and EPA. Election-day and lead-up weather come from PRISM 4km daily grids and the NOAA Global Historical Climatology Network. Mail-voting and election-administration patterns come from the MIT Election Lab's Survey of the Performance of American Elections. Block-group crime detail comes from CrimeGrade. Internet data and modeling support provided by ISPreports.org.
Modeling and analysis by the BestNeighborhood data science team. Full methodology and findings: political spectrum map.
Methodology reviewed by the BestNeighborhood data team. Last updated May 2026.