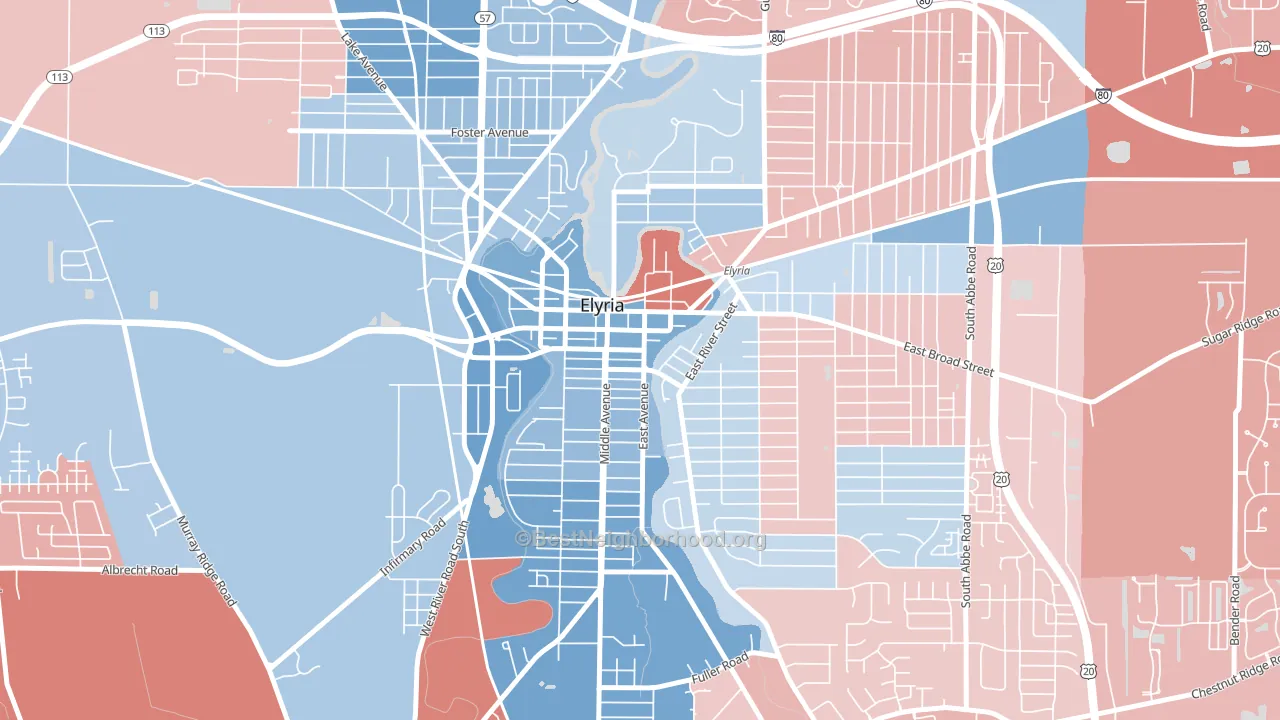
Downtown Elyria leans slightly Democratic by roughly 14 points: about 57% of voters vote Democratic and 43% Republican.
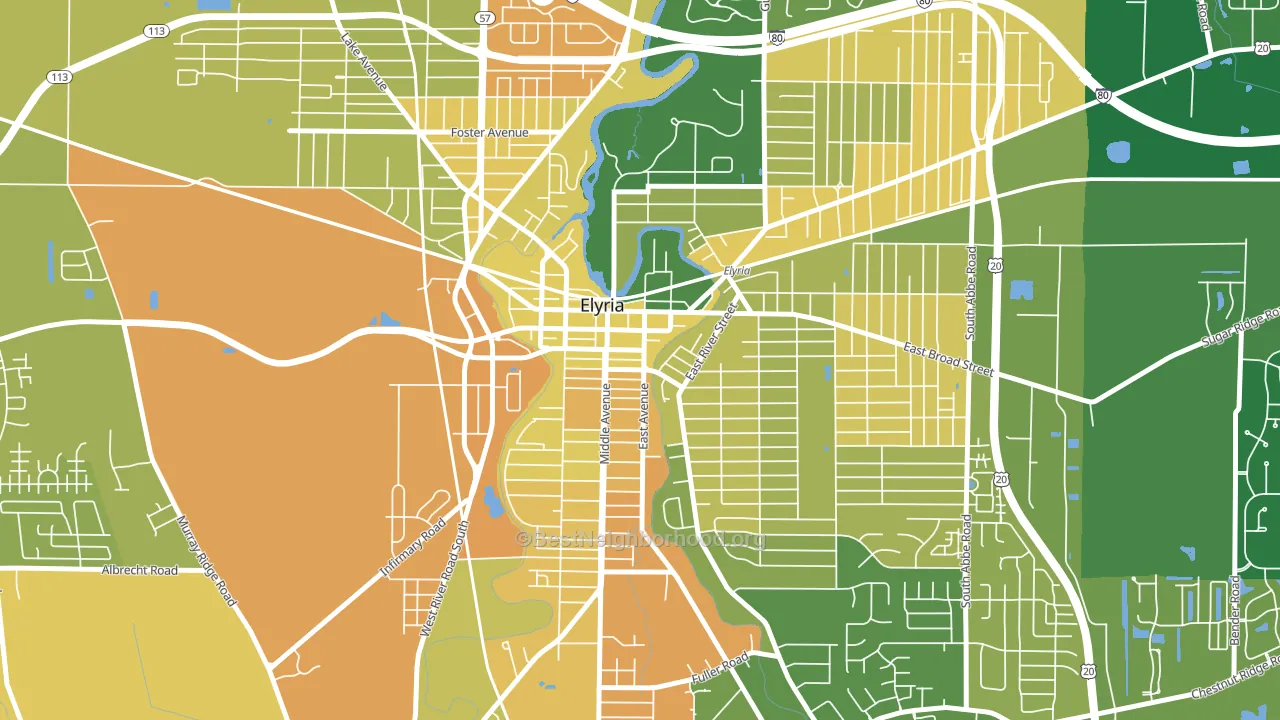
About 53% of adults in Downtown Elyria typically vote, below the U.S. average of about 62%. Among adults in Downtown Elyria, ~30% vote Democratic, ~23% Republican, and ~47% don't vote. The map below shows estimated turnout by block group.
How Downtown Elyria compares
Downtown Elyria runs about 26 points more Democratic than Ohio as a whole. Ohio leans Republican overall, while Downtown Elyria is one of the few Democratic-leaning pockets.
Politics vary noticeably by block within Downtown Elyria. The southwest side is the most Democratic-leaning (D+32) and the southeast side is the least Democratic-leaning (D+3), a spread of about 29 points.
Why Downtown Elyria leans the way it does
This analysis examined 14,881 data points per neighborhood to find what predicts political lean and turnout. The items below are a few correlations that stood out for Downtown Elyria, not a ranked or complete list of what matters most.
Downtown Elyria votes against the grain of Ohio. Ohio leans Republican overall, while Downtown Elyria runs about 26 points more Democratic. A high never-married share predicts Democratic voting, and about 48% of adults in Downtown Elyria have never been married, above 78% of neighborhoods.
Paved land cover and Democratic lean
Places with extensive paved surfaces tend to lean Democratic; Downtown Elyria, Elyria, OH sits above the national average on this measure. Paved ground does not change how people vote; it mostly reflects how urban and built-up a place is.
Why turnout in Downtown Elyria looks the way it does
Areas with low high-school completion turn out at lower rates. About 82% of adults in Downtown Elyria have completed high school, about 7 points below the U.S. average of 90%. Learn more about the findings and methodology on the political spectrum map.
Nearby Neighborhoods
- South Lorain, Lorain, OH D+21
- Downtown Lorain, Lorain, OH D+15
- Kamms Corner, Cleveland, OH D+22
- Puritas Longmead, Cleveland, OH D+28
- Jefferson, Cleveland, OH D+23
- Madison Village, Lakewood, OH D+41
- West Boulevard, Cleveland, OH D+30
- Polish Village, Parma, OH R+4
- Cudell, Cleveland, OH D+37
- Edgewater, Cleveland, OH D+54
Neighborhoods with Similar Populations
- West Huntington, Huntington, WV R+13
- Sequoyah, Tulsa, OK D+11
- Lettered Streets, Bellingham, WA D+73
- Marvintown, Erie, PA D+27
- Locust Point, Baltimore, MD D+46
- Belmont, Detroit, MI D+87
- Woodbury-Glendale, Glendale, CA D+26
- Embassy Lakes, Cooper City, FL D+5
- Northeast Garland, Garland, TX D+12
- Oaklawn, Cranston, RI Even
Sources and methodology
Precinct-level voting records used to fit the model come from Ohio Secretary of State, Elections, distributed by the Voting and Election Science Team. Demographic inputs come from the U.S. Census Bureau (ACS 5-year estimates and the 2020 Decennial Census). Health and environmental inputs come from the CDC (PLACES and the Environmental Justice Index). Land cover comes from the USGS and EPA. Election-day and lead-up weather come from PRISM 4km daily grids and the NOAA Global Historical Climatology Network. Mail-voting and election-administration patterns come from the MIT Election Lab's Survey of the Performance of American Elections. Block-group crime detail comes from CrimeGrade. Internet data and modeling support provided by ISPreports.org.
Modeling and analysis by the BestNeighborhood data science team. Full methodology and findings: political spectrum map.
Methodology reviewed by the BestNeighborhood data team. Last updated May 2026.