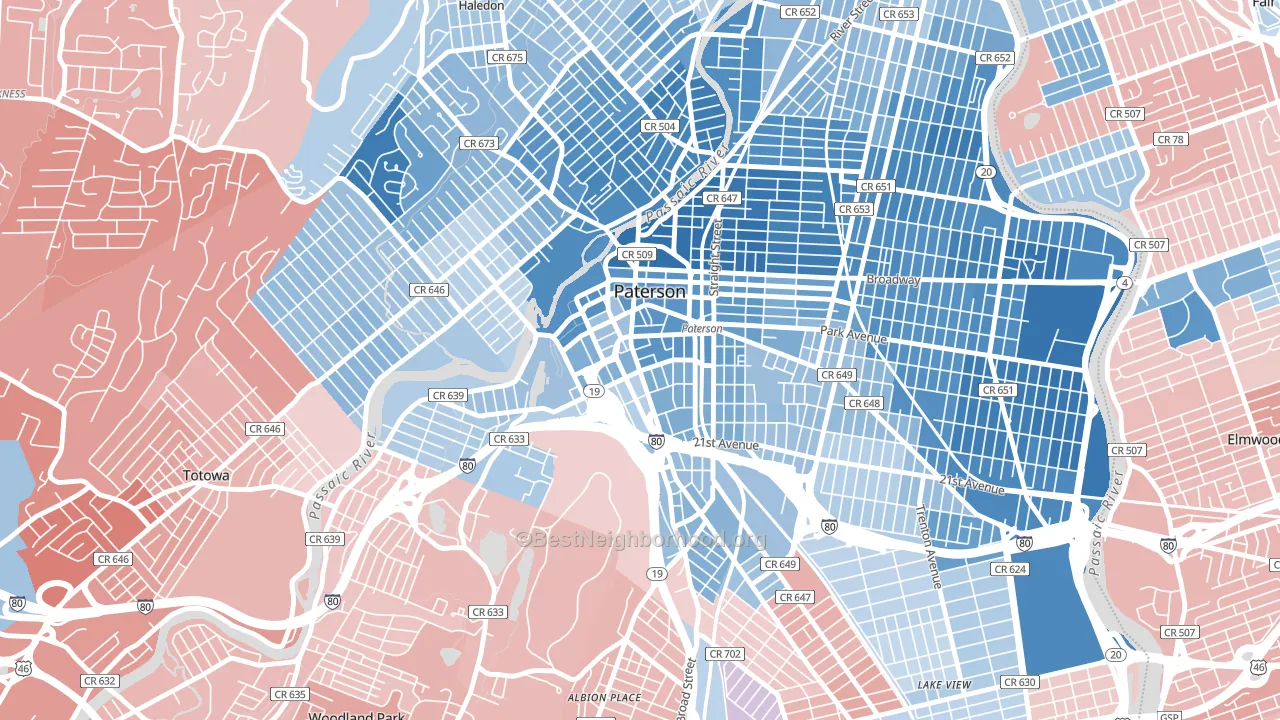
Downtown Paterson leans heavily Democratic by roughly 32 points: about 66% of voters vote Democratic and 34% Republican.
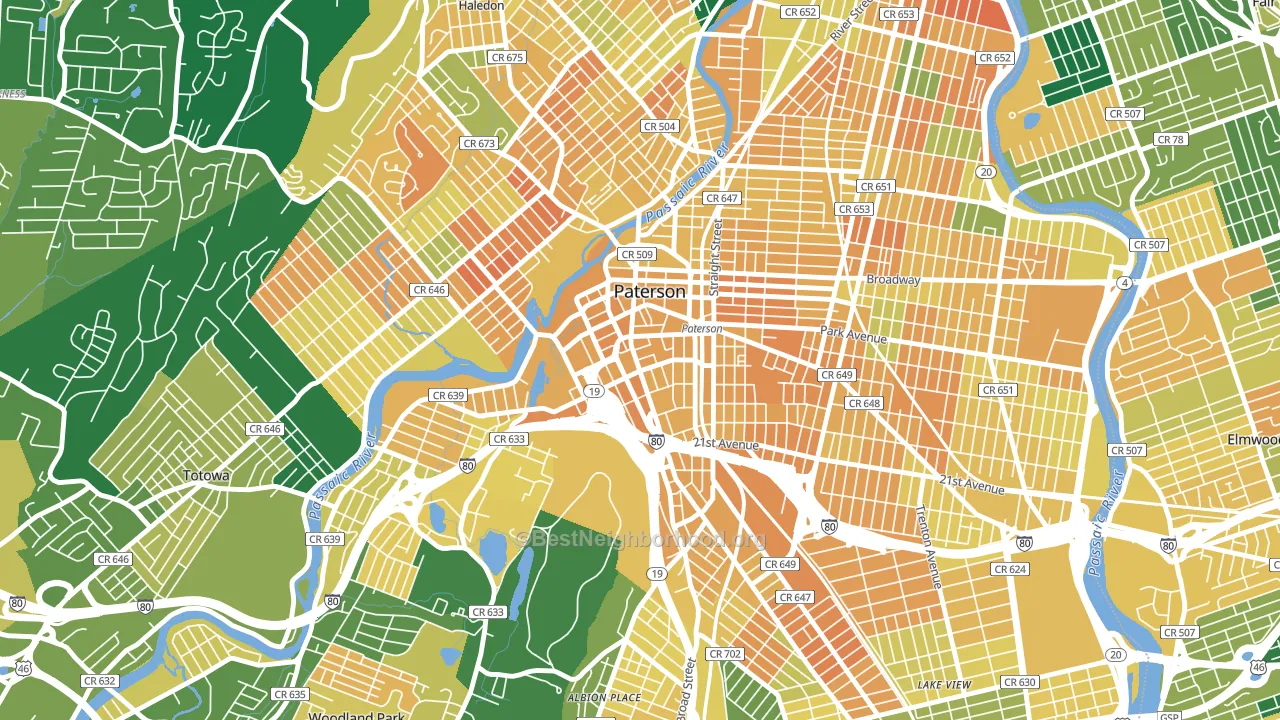
About 32% of adults in Downtown Paterson typically vote, below the U.S. average of about 62%. Among adults in Downtown Paterson, ~21% vote Democratic, ~11% Republican, and ~68% don't vote. The map below shows estimated turnout by block group.
How Downtown Paterson compares
Among neighborhoods within 5 miles, Downtown Paterson is the most Democratic-leaning.
Downtown Paterson runs about 26 points more Democratic than New Jersey as a whole.
Politics vary noticeably by block within Downtown Paterson. The north side is the most Democratic-leaning (D+57) and the southwest side is the least Democratic-leaning (D+14), a spread of about 43 points.
Why Downtown Paterson leans the way it does
This analysis examined 14,881 data points per neighborhood to find what predicts political lean and turnout. The items below are a few correlations that stood out for Downtown Paterson, not a ranked or complete list of what matters most.
Areas with many never-married adults vote Democratic. About 59% of adults in Downtown Paterson have never been married, modestly above similar-sized neighborhoods (around 50%).
Preventive-care access and voter turnout
Places with limited routine preventive-care access tend to turn out at a lower rate; Downtown Paterson, Paterson, NJ sits in the bottom tenth nationally on this measure. Dental visits do not drive turnout; the rate reflects income, insurance, and healthcare access, which line up with who votes.
Why turnout in Downtown Paterson looks the way it does
Areas with limited routine healthcare access turn out at lower rates. Downtown Paterson is in the bottom quarter nationally for routine-care measures such as insurance coverage, preventive screenings, and dental visits. The dental-visit rate here is about 41%, about 27 points below the New Jersey average of 67%. Renters vote less often than owners, and about 91% of households in Downtown Paterson rent, compared to around 33% in nearby neighborhoods. High food insecurity lines up with lower turnout, and about 49% of adults in Downtown Paterson report food insecurity, above 98% of neighborhoods. Learn more about the findings and methodology on the political spectrum map.
Nearby Neighborhoods
- Albion Place, Clifton, NJ R+3
- Lake View, Paterson, NJ D+5
- Radburn, Fair Lawn, NJ D+8
- Richfield, Clifton, NJ D+8
- Warren Point, Fair Lawn, NJ Even
- Passaic Junction, Saddle Brook, NJ R+18
- Athenia, Clifton, NJ D+5
- Ridgewood Junction, Glen Rock, NJ D+21
- Allwood, Clifton, NJ Even
- Downtown Ridgewood, Ridgewood, NJ D+30
Neighborhoods with Similar Populations
- Monta Loma, Mountain View, CA D+46
- Lower East Side, Milwaukee, WI D+61
- Wanskuck, Providence, RI D+40
- Scotlandville, Baton Rouge, LA D+84
- Southwyck, Toledo, OH D+35
- Flatbush-Ditmas Park, Brooklyn, NY D+84
- Benton Park, Bakersfield, CA D+6
- Beechfielf-Irvington Area, Baltimore, MD D+83
- Eastmoor, Columbus, OH D+56
- Jamestown, Hephzibah, GA D+71
Sources and methodology
Precinct-level voting records used to fit the model come from New Jersey Division of Elections, distributed by the Voting and Election Science Team. Demographic inputs come from the U.S. Census Bureau (ACS 5-year estimates and the 2020 Decennial Census). Health and environmental inputs come from the CDC (PLACES and the Environmental Justice Index). Land cover comes from the USGS and EPA. Election-day and lead-up weather come from PRISM 4km daily grids and the NOAA Global Historical Climatology Network. Mail-voting and election-administration patterns come from the MIT Election Lab's Survey of the Performance of American Elections. Block-group crime detail comes from CrimeGrade. Internet data and modeling support provided by ISPreports.org.
Modeling and analysis by the BestNeighborhood data science team. Full methodology and findings: political spectrum map.
Methodology reviewed by the BestNeighborhood data team. Last updated May 2026.