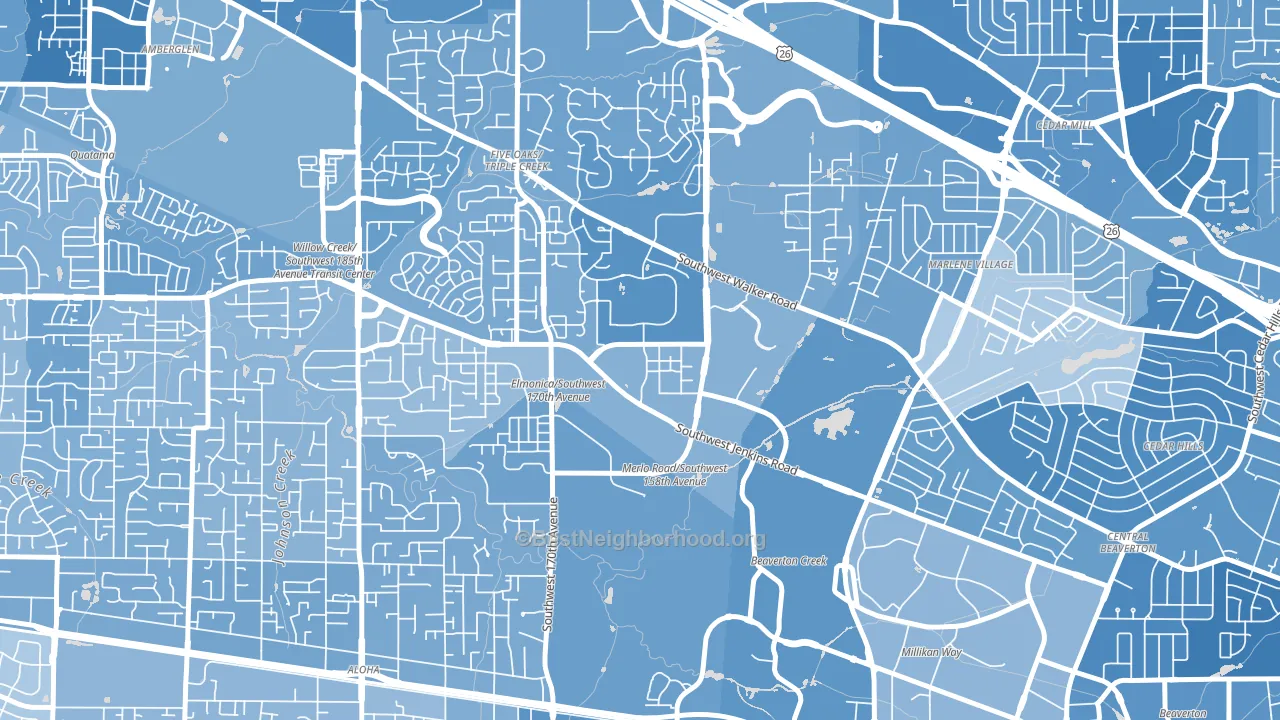
Five Oaks leans heavily Democratic by roughly 40 points: about 70% of voters vote Democratic and 30% Republican.
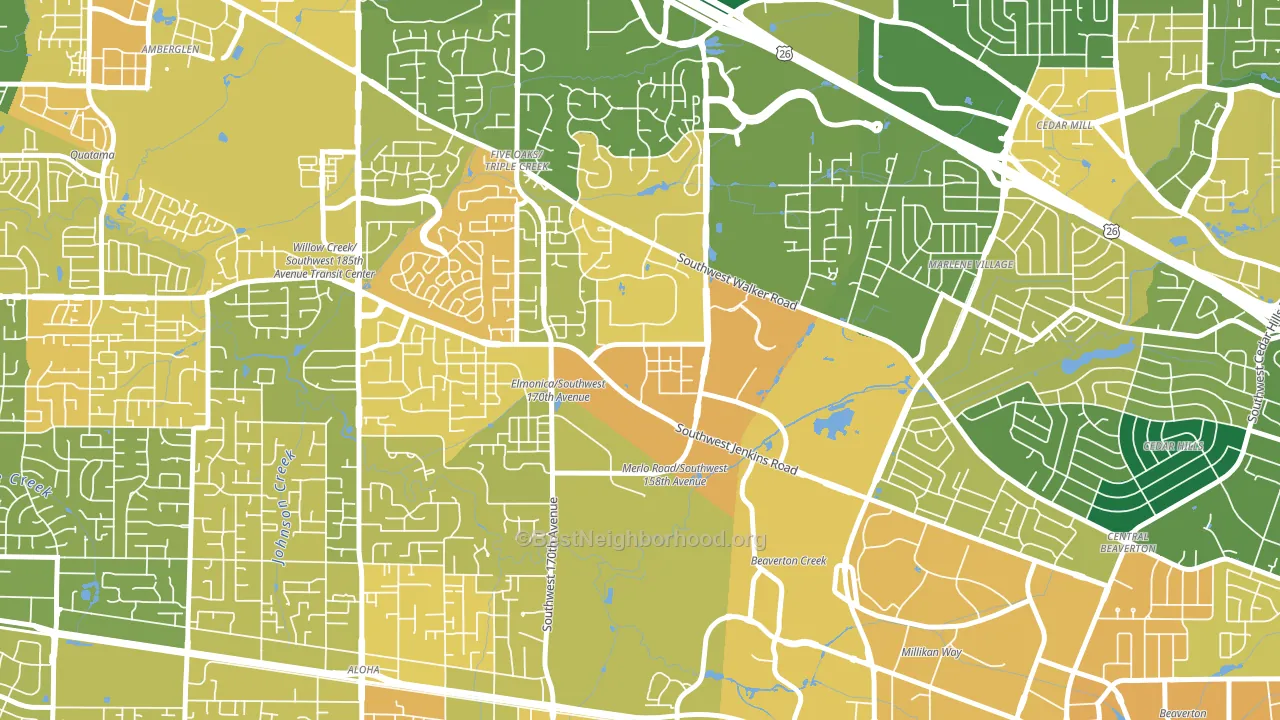
About 61% of adults in Five Oaks typically vote, near the U.S. average of about 62%. Among adults in Five Oaks, ~43% vote Democratic, ~18% Republican, and ~39% don't vote. The map below shows estimated turnout by block group.
How Five Oaks compares
Among neighborhoods within 5 miles, Five Oaks leans more Democratic than 8 of 19 neighbors.
Five Oaks runs about 27 points more Democratic than Oregon as a whole.
Why Five Oaks leans the way it does
Density, race composition, education, and family structure all sit close to their national averages in Five Oaks. The lean here lands roughly where demographic data alone would predict.
Population density and Democratic lean
Places with high population density tend to lean Democratic; Five Oaks, Beaverton, OR sits in the top quarter nationally on this measure.
Why turnout in Five Oaks looks the way it does
Renters vote less often than owners. About 70% of households in Five Oaks rent, about 45 points above the U.S. average of 25%. Learn more about the findings and methodology on the political spectrum map.
Nearby Neighborhoods
- Triple Creek, Beaverton, OR D+36
- Cooper Mountain-Aloha North, Aloha, OR D+29
- Cedar Hills-Cedar Mill North, Beaverton, OR D+42
- Sommerset West-Elmonica South, Hillsboro, OR D+44
- West Beaverton, Beaverton, OR D+39
- Central Beaverton, Beaverton, OR D+48
- Cedar Hills-Cedar Mill, Portland, OR D+49
- Sommerset West-Elmonica North, Bethany, OR D+39
- Highlands, Beaverton, OR D+38
- Cooper Mountain Aloha South, Beaverton, OR D+28
Neighborhoods with Similar Populations
- Russian Jack Park, Anchorage, AK D+23
- Meridian-Kessler, Indianapolis, IN D+57
- Millenia, Orlando, FL D+34
- Yorkmount, Charlotte, NC D+47
- Lawncrest, Philadelphia, PA D+59
- Woodlawn Hayattsville, Hyattsville, MD D+65
- Old North Milwaukee, Milwaukee, WI D+85
- Radburn, Fair Lawn, NJ D+8
- Allandale, Austin, TX D+54
- Glendale-Heatherdowns, Toledo, OH D+24
Sources and methodology
Precinct-level voting records used to fit the model come from Oregon Secretary of State, Elections Division, distributed by the Voting and Election Science Team. Demographic inputs come from the U.S. Census Bureau (ACS 5-year estimates and the 2020 Decennial Census). Health and environmental inputs come from the CDC (PLACES and the Environmental Justice Index). Land cover comes from the USGS and EPA. Election-day and lead-up weather come from PRISM 4km daily grids and the NOAA Global Historical Climatology Network. Mail-voting and election-administration patterns come from the MIT Election Lab's Survey of the Performance of American Elections. Block-group crime detail comes from CrimeGrade. Internet data and modeling support provided by ISPreports.org.
Modeling and analysis by the BestNeighborhood data science team. Full methodology and findings: political spectrum map.
Methodology reviewed by the BestNeighborhood data team. Last updated May 2026.