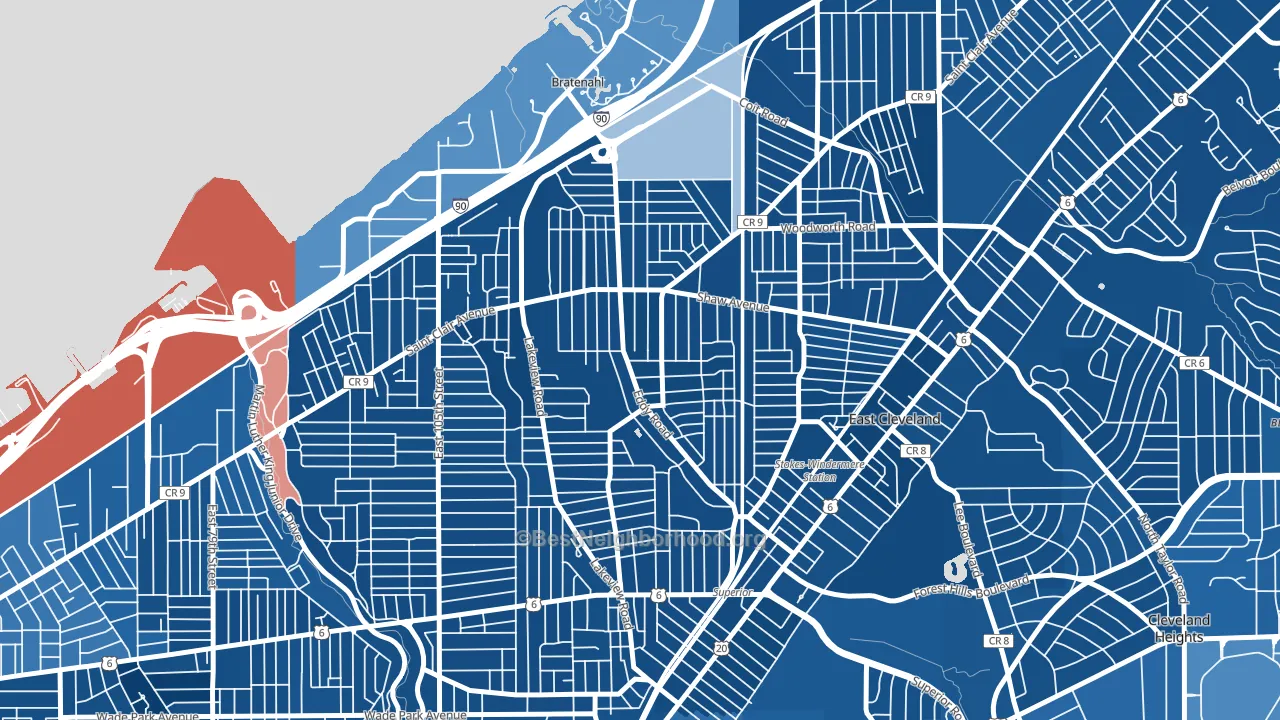
Forest Hills is a Democratic stronghold. About 94% of voters here vote Democratic and 6% Republican.
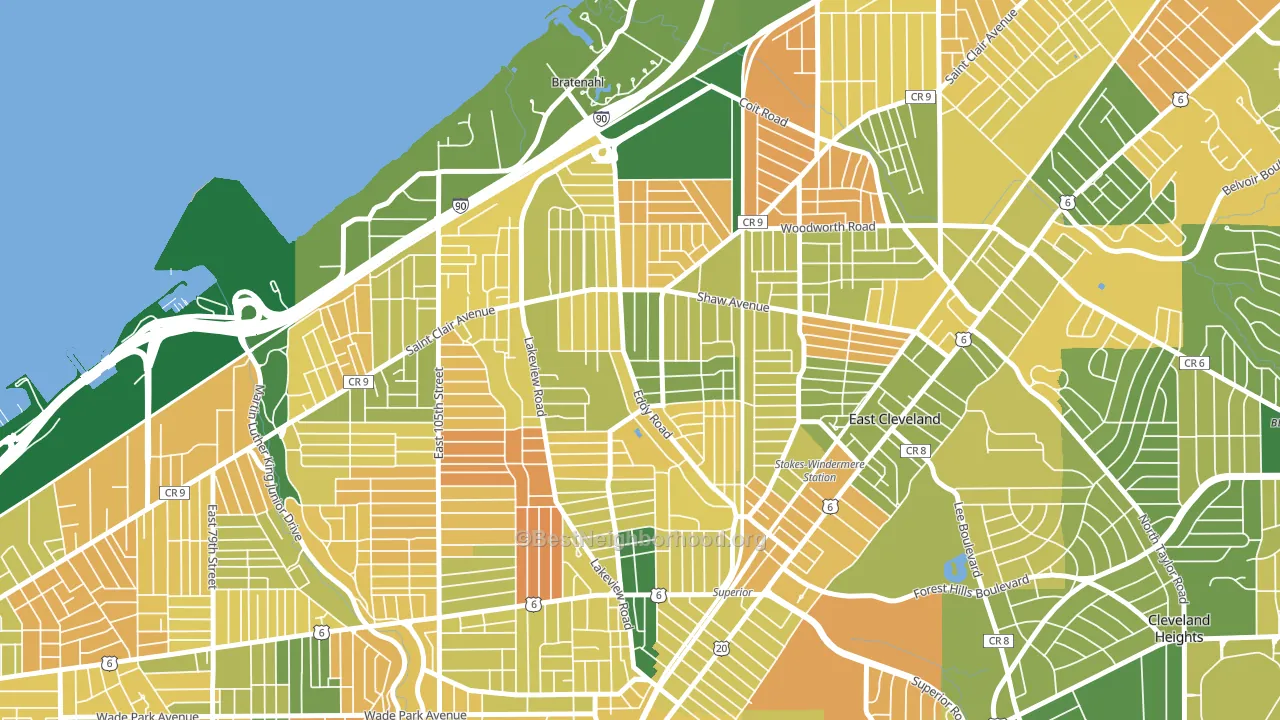
About 57% of adults in Forest Hills typically vote, near the U.S. average of about 62%. Among adults in Forest Hills, ~53% vote Democratic, ~3% Republican, and ~44% don't vote. The map below shows estimated turnout by block group.
How Forest Hills compares
Among neighborhoods within 5 miles, Forest Hills is the most Democratic-leaning.
Forest Hills runs about 99 points more Democratic than Ohio as a whole. Ohio leans Republican overall, while Forest Hills is one of the few Democratic-leaning pockets.
Why Forest Hills leans the way it does
This analysis examined 14,881 data points per neighborhood to find what predicts political lean and turnout. The items below are a few correlations that stood out for Forest Hills, not a ranked or complete list of what matters most.
Dense areas vote Democratic. More than 99% of residents in Forest Hills live in densely developed areas, about 64 points above the U.S. average of 36%. A high never-married share predicts Democratic voting, and about 54% of adults in Forest Hills have never been married, above 88% of neighborhoods. Forest Hills runs against the grain of Ohio, a Democratic-leaning pocket in a Republican-leaning state.
Preventive-care access and voter turnout
Places with limited routine preventive-care access tend to turn out at a lower rate; Forest Hills, Cleveland, OH sits in the bottom quarter nationally on this measure. Dental visits do not drive turnout; the rate reflects income, insurance, and healthcare access, which line up with who votes.
Why turnout in Forest Hills looks the way it does
Areas with high food insecurity turn out at lower rates. About 43% of adults in Forest Hills report food insecurity, about 27 points above the U.S. average of 16%. Low high-school completion lines up with lower turnout, and about 80% of adults in Forest Hills have completed high school, below 85% of neighborhoods. High-crime urban areas turn out at lower rates, and Forest Hills sits in the top 15% on a violent-crime measure. Learn more about the findings and methodology on the political spectrum map.
Nearby Neighborhoods
- Glenville, Cleveland, OH D+87
- University District, Cleveland, OH D+73
- South Collinwood, Cleveland, OH D+83
- Saint Claire-Superior, Cleveland, OH D+76
- Hough, Cleveland, OH D+85
- Euclid-Green, Cleveland, OH D+87
- Fairfax, Cleveland, OH D+87
- North Collinwood, Cleveland, OH D+71
- Goodrich-Kirtland Park, Cleveland, OH D+45
- Buckeye-Shaker, Cleveland, OH D+83
Neighborhoods with Similar Populations
- Algonquin, Louisville, KY D+72
- Lincoln Village West, Stockton, CA D+11
- Cliffcannon, Spokane, WA D+46
- Becks Park, Chicago, IL D+80
- Fifth by Northwest, Columbus, OH D+48
- North Indian Trail, Spokane, WA R+4
- Charlotte, Rochester, NY D+22
- Murray Hill, Jacksonville, FL D+10
- Foothills, Fortuna Foothills, AZ R+34
- Beechwood, Rochester, NY D+70
Sources and methodology
Precinct-level voting records used to fit the model come from Ohio Secretary of State, Elections, distributed by the Voting and Election Science Team. Demographic inputs come from the U.S. Census Bureau (ACS 5-year estimates and the 2020 Decennial Census). Health and environmental inputs come from the CDC (PLACES and the Environmental Justice Index). Land cover comes from the USGS and EPA. Election-day and lead-up weather come from PRISM 4km daily grids and the NOAA Global Historical Climatology Network. Mail-voting and election-administration patterns come from the MIT Election Lab's Survey of the Performance of American Elections. Block-group crime detail comes from CrimeGrade. Internet data and modeling support provided by ISPreports.org.
Modeling and analysis by the BestNeighborhood data science team. Full methodology and findings: political spectrum map.
Methodology reviewed by the BestNeighborhood data team. Last updated May 2026.