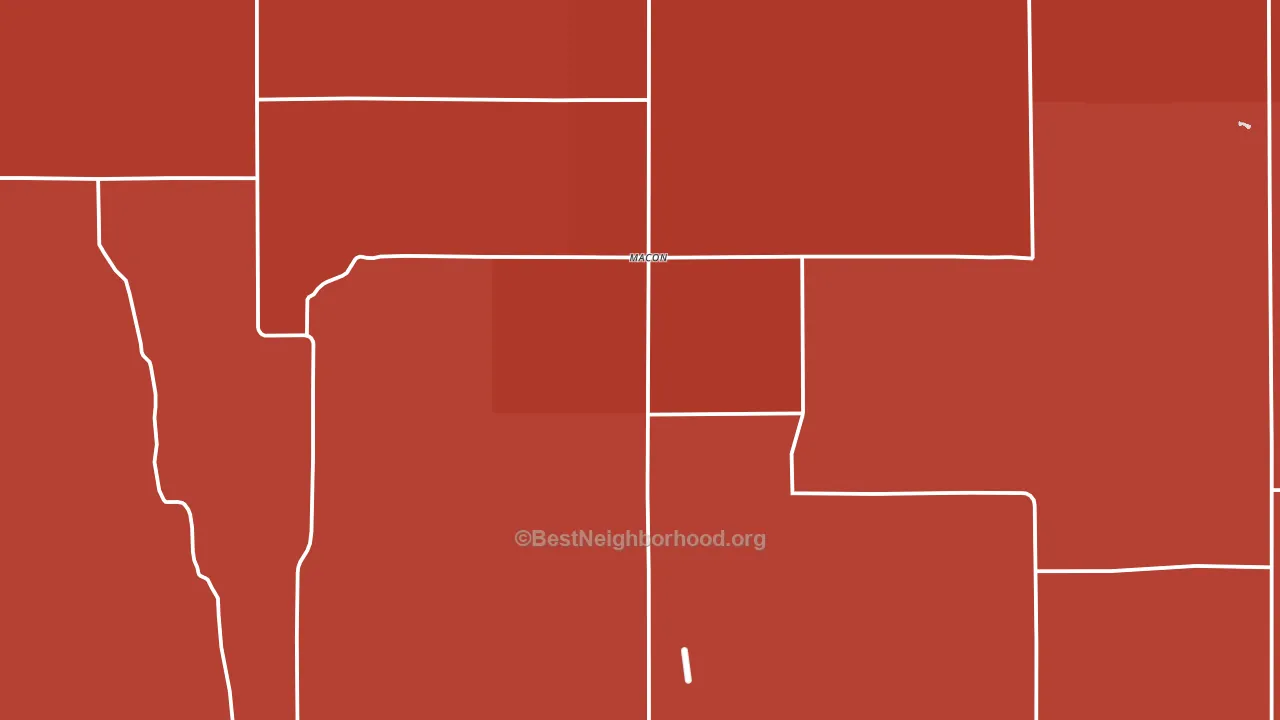
Franklin County is a Republican stronghold. About 15% of voters here vote Democratic and 85% Republican.
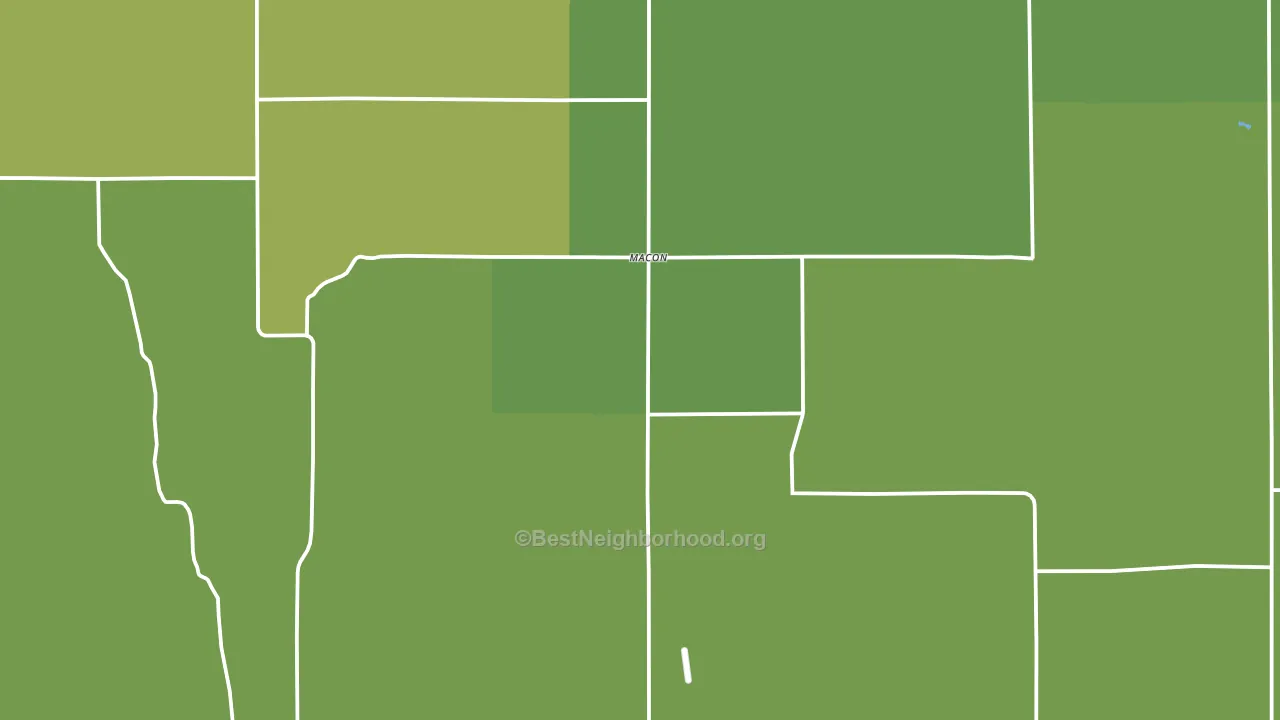
About 76% of adults in Franklin County typically vote, above the U.S. average of about 62%. Among adults in Franklin County, ~11% vote Democratic, ~65% Republican, and ~24% don't vote. The map below shows estimated turnout by block group.
How Franklin County compares
Among counties within 50 miles, Franklin County leans more Republican than 6 of 10 neighbors.
Franklin County runs about 49 points more Republican than Nebraska as a whole.
Why Franklin County leans the way it does
This analysis examined 14,881 data points per county to find what predicts political lean and turnout. The items below are a few correlations that stood out for Franklin County, not a ranked or complete list of what matters most.
Rural areas vote Republican. About 4% of residents in Franklin County live in densely developed areas, about 13 points below the Nebraska average of 17%.
Population density and Republican lean
Places with low population density tend to lean Republican; Franklin County, NE sits in the bottom tenth nationally on this measure.
Why turnout in Franklin County looks the way it does
Homeowners vote more often than renters. About 83% of households in Franklin County own their home, about 6 points above the Nebraska average of 77%. High high-school completion lines up with higher turnout, and about 94% of adults in Franklin County have completed high school, above 80% of counties. Learn more about the findings and methodology on the political spectrum map.
Nearby Counties
- Kearney County, NE R+59
- Harlan County, NE R+69
- Webster County, NE R+69
- Smith County, KS R+72
- Phelps County, NE R+58
- Phillips County, KS R+68
- Buffalo County, NE R+36
- Adams County, NE R+42
- Nuckolls County, NE R+60
- Jewell County, KS R+73
Counties with Similar Populations
- Glascock County, GA R+80
- Baker County, GA R+16
- Brown County, NE R+74
- Edwards County, KS R+65
- Perkins County, NE R+76
- Clay County, GA D+18
- Jewell County, KS R+73
- Lincoln County, KS R+67
- Perkins County, SD R+68
- Douglas County, SD R+68
Sources and methodology
Precinct-level voting records used to fit the model come from Nebraska Secretary of State, Elections, distributed by the Voting and Election Science Team. Demographic inputs come from the U.S. Census Bureau (ACS 5-year estimates and the 2020 Decennial Census). Health and environmental inputs come from the CDC (PLACES and the Environmental Justice Index). Land cover comes from the USGS and EPA. Election-day and lead-up weather come from PRISM 4km daily grids and the NOAA Global Historical Climatology Network. Mail-voting and election-administration patterns come from the MIT Election Lab's Survey of the Performance of American Elections. Block-group crime detail comes from CrimeGrade. Internet data and modeling support provided by ISPreports.org.
Modeling and analysis by the BestNeighborhood data science team. Full methodology and findings: political spectrum map.
Methodology reviewed by the BestNeighborhood data team. Last updated May 2026.