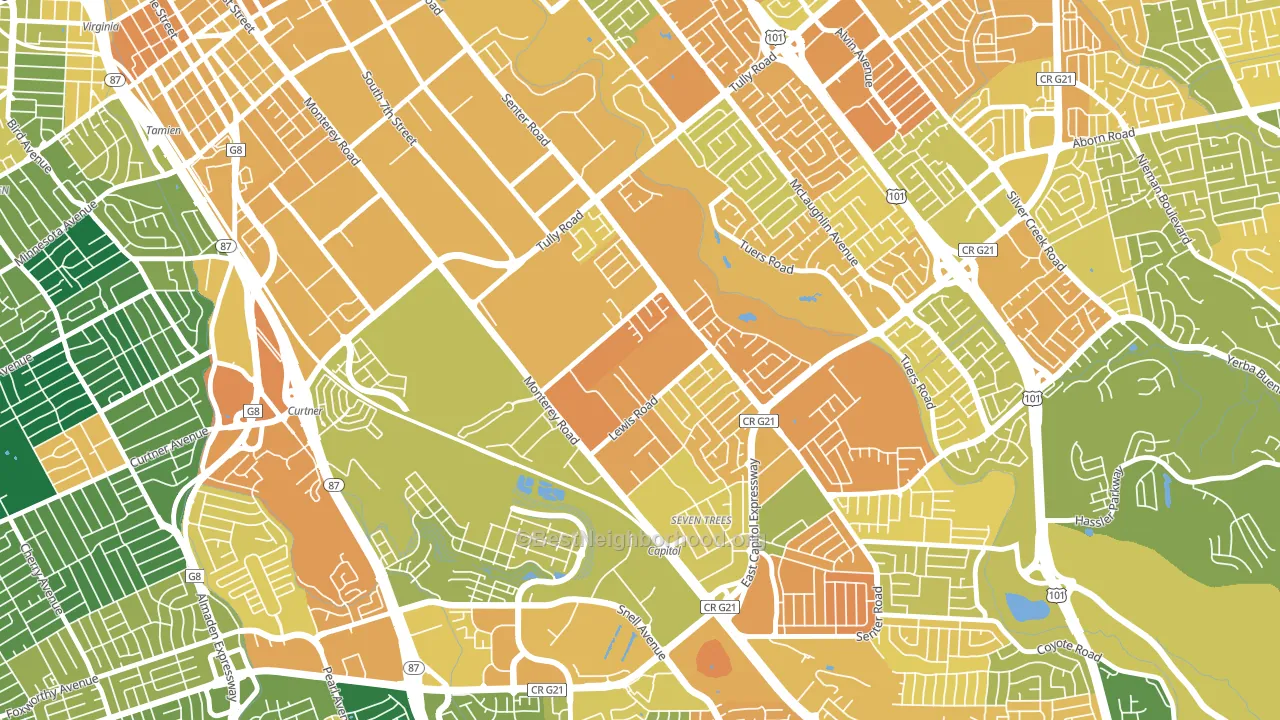
Garden-Villa Montery leans heavily Democratic by roughly 32 points: about 66% of voters vote Democratic and 34% Republican.
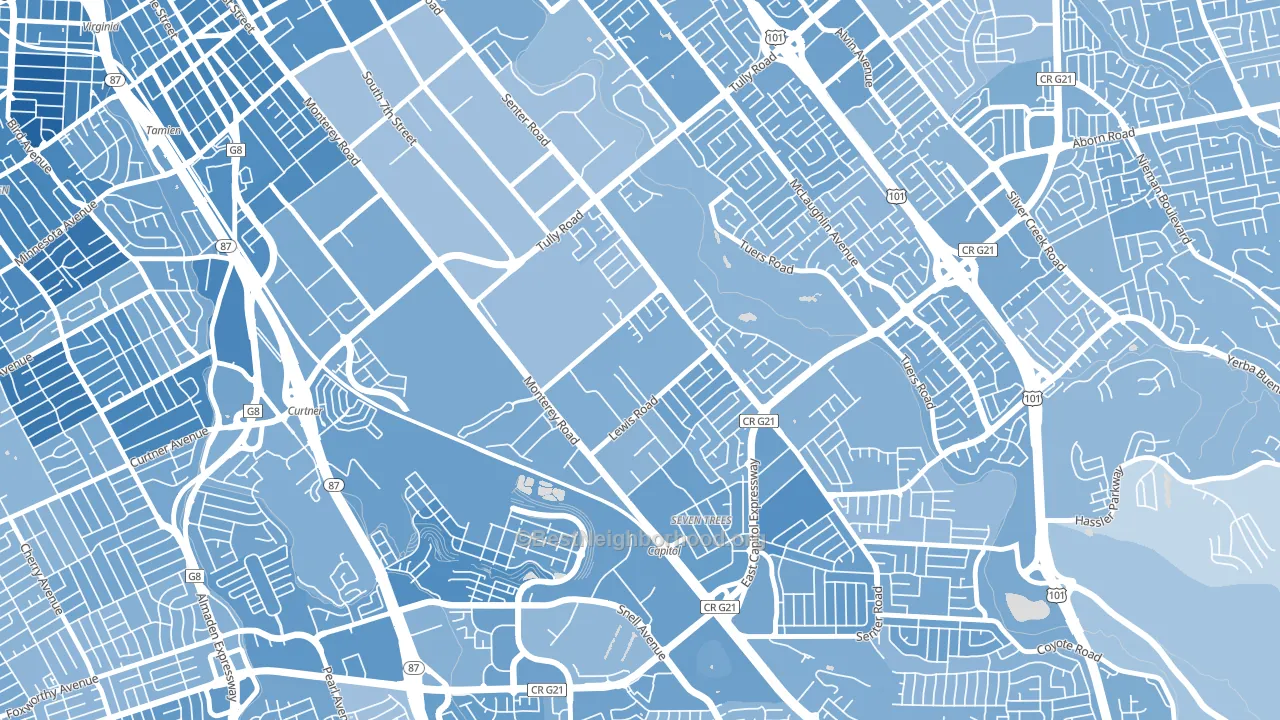
About 30% of adults in Garden-Villa Montery typically vote, below the U.S. average of about 62%. Among adults in Garden-Villa Montery, ~20% vote Democratic, ~10% Republican, and ~70% don't vote. The map below shows estimated turnout by block group.
How Garden-Villa Montery compares
Among neighborhoods within 5 miles, Garden-Villa Montery leans more Democratic than 6 of 10 neighbors.
Garden-Villa Montery runs about 12 points more Democratic than California as a whole.
Why Garden-Villa Montery leans the way it does
This analysis examined 14,881 data points per neighborhood to find what predicts political lean and turnout. The items below are a few correlations that stood out for Garden-Villa Montery, not a ranked or complete list of what matters most.
Dense areas vote Democratic. More than 99% of residents in Garden-Villa Montery live in densely developed areas, about 64 points above the U.S. average of 36%. A high never-married share predicts Democratic voting, and about 50% of adults in Garden-Villa Montery have never been married, above 81% of neighborhoods.
Paved land cover and Democratic lean
Places with extensive paved surfaces tend to lean Democratic; Garden-Villa Montery, San Jose, CA sits in the top tenth nationally on this measure. Paved ground does not change how people vote; it mostly reflects how urban and built-up a place is.
Why turnout in Garden-Villa Montery looks the way it does
Crowded housing lines up with lower turnout. About 11% of homes in Garden-Villa Montery have more than one occupant per room, above 93% of neighborhoods. Learn more about the findings and methodology on the political spectrum map.
Nearby Neighborhoods
- Edenvale-Seven Trees, San Jose, CA D+28
- Alma, San Jose, CA D+36
- East San Jose, San Jose, CA D+27
- Blossom Valley, San Jose, CA D+25
- Willow Glen, San Jose, CA D+37
- Naglee Park, San Jose, CA D+53
- Evergreen, San Jose, CA D+22
- Downtown San Jose, San Jose, CA D+47
- Cambrian Park, San Jose, CA D+28
- Santa Teresa, San Jose, CA D+26
Neighborhoods with Similar Populations
- Crescent Area Historic District, Plainfield, NJ D+43
- Tarrytown, Gary, IN D+82
- Downtown Juneau, Juneau, AK D+50
- Presidents Park, Parlin, NJ R+10
- Homestead Park, Homestead, PA D+62
- Santiam, Albany, OR Even
- Midtown Savannah, Savannah, GA D+71
- Rosebank, Nashville, TN D+20
- Harris Park, St. Petersburg, FL D+5
- North City Farms, Sacramento, CA D+51
Sources and methodology
Precinct-level voting records used to fit the model come from California Secretary of State, Elections, distributed by the Voting and Election Science Team. Demographic inputs come from the U.S. Census Bureau (ACS 5-year estimates and the 2020 Decennial Census). Health and environmental inputs come from the CDC (PLACES and the Environmental Justice Index). Land cover comes from the USGS and EPA. Election-day and lead-up weather come from PRISM 4km daily grids and the NOAA Global Historical Climatology Network. Mail-voting and election-administration patterns come from the MIT Election Lab's Survey of the Performance of American Elections. Block-group crime detail comes from CrimeGrade. Internet data and modeling support provided by ISPreports.org.
Modeling and analysis by the BestNeighborhood data science team. Full methodology and findings: political spectrum map.
Methodology reviewed by the BestNeighborhood data team. Last updated May 2026.