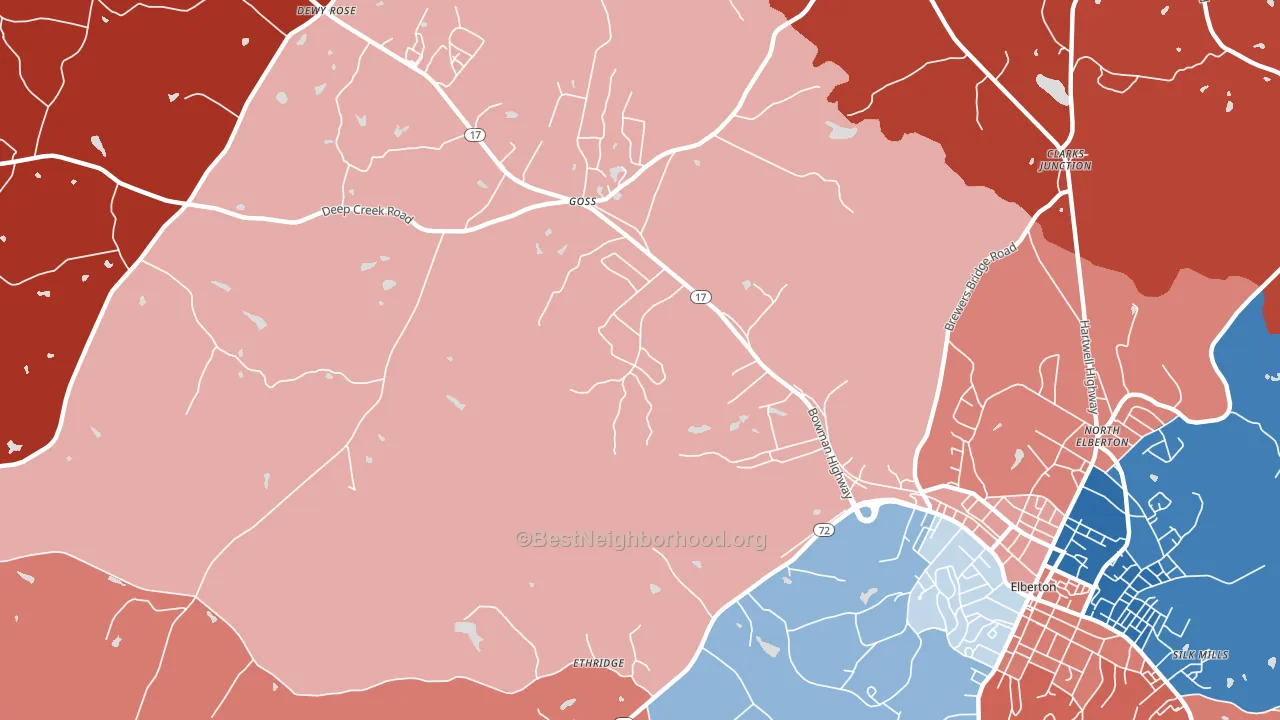
Goss leans slightly Republican by roughly 8 points: about 46% of voters vote Democratic and 54% Republican.
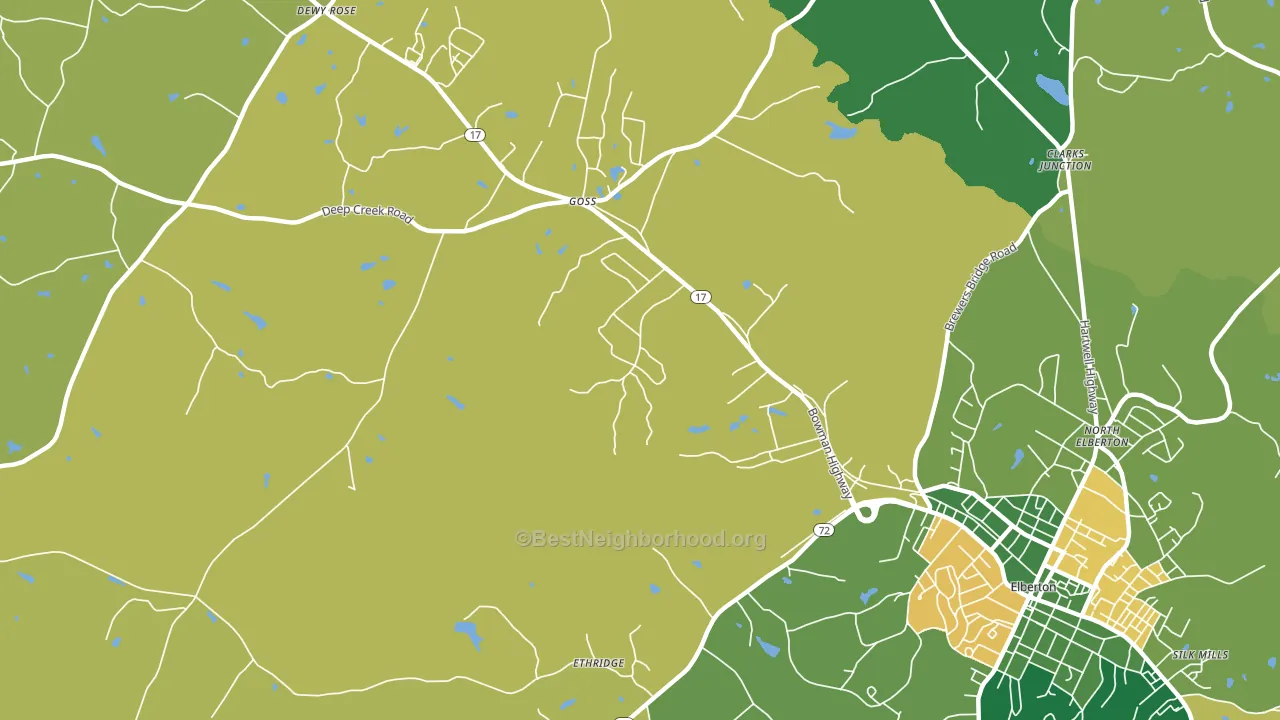
About 68% of adults in Goss typically vote, above the U.S. average of about 62%. Among adults in Goss, ~31% vote Democratic, ~37% Republican, and ~32% don't vote. The map below shows estimated turnout by block group.
How Goss compares
Among cities within 25 miles, Goss leans more Republican than 2 of 57 neighbors.
Goss runs about 5 points more Republican than Georgia as a whole.
Why Goss leans the way it does
This analysis examined 14,881 data points per city to find what predicts political lean and turnout. The items below are a few correlations that stood out for Goss, not a ranked or complete list of what matters most.
Car-dependent areas vote Republican. About 89% of residents in Goss drive to work alone, about 15 points above the U.S. average of 74%. Low college attainment predicts Republican voting, and Goss sits in the bottom quarter (about 15%, below 79% of cities). A high family-household share predicts Republican voting, and about 78% of households in Goss are family households, above 86% of cities.
Renting and voter turnout
Places with homeowner-heavy households tend to turn out at a higher rate; Goss, GA sits in the bottom quarter nationally on this measure.
Why turnout in Goss looks the way it does
Homeowners vote more often than renters. About 91% of households in Goss own their home, about 18 points above the Georgia average of 73%. Limited routine healthcare access lines up with lower turnout, and Goss sits in the bottom quarter on routine-care measures. Learn more about the findings and methodology on the political spectrum map.
Nearby Cities
- Elberton, GA R+23
- Dove Creek, GA R+34
- Dewy Rose, GA R+45
- Match, GA R+58
- Ruckersville, GA R+68
- Montevideo, GA R+30
- Bowman, GA R+60
- Carlton, GA R+55
- Paoli, GA R+60
- Middleton, GA R+62
Cities with Similar Populations
- Kearsarge, PA Even
- Shawnee, GA R+62
- Nat, TX R+72
- Slaughter Beach, DE R+17
- Old Shongaloo, LA R+85
- Milledgeville, PA R+60
- Gaines, MO R+66
- Cowan, KY R+66
- Nestlow, WV R+64
- Elton, WI R+46
Sources and methodology
Precinct-level voting records used to fit the model come from Georgia Elections Division, distributed by the Voting and Election Science Team. Demographic inputs come from the U.S. Census Bureau (ACS 5-year estimates and the 2020 Decennial Census). Health and environmental inputs come from the CDC (PLACES and the Environmental Justice Index). Land cover comes from the USGS and EPA. Election-day and lead-up weather come from PRISM 4km daily grids and the NOAA Global Historical Climatology Network. Mail-voting and election-administration patterns come from the MIT Election Lab's Survey of the Performance of American Elections. Block-group crime detail comes from CrimeGrade. Internet data and modeling support provided by ISPreports.org.
Modeling and analysis by the BestNeighborhood data science team. Full methodology and findings: political spectrum map.
Methodology reviewed by the BestNeighborhood data team. Last updated May 2026.