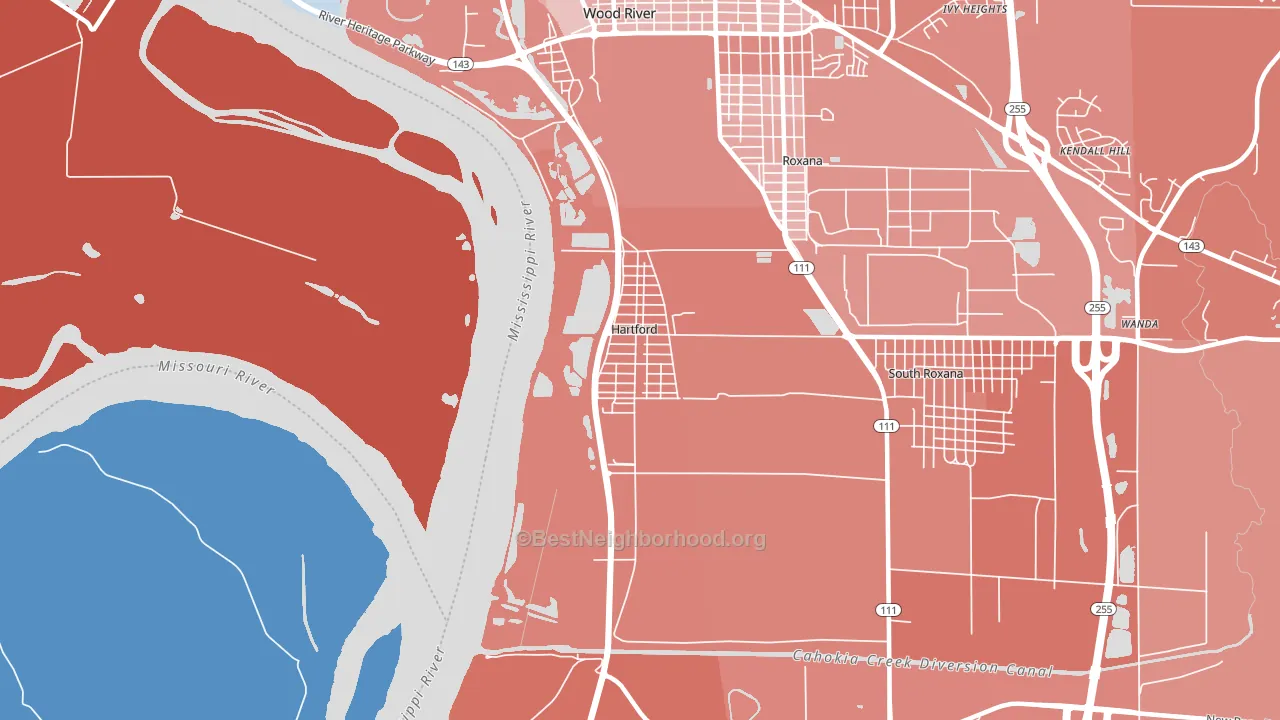
Hartford leans heavily Republican by roughly 32 points: about 34% of voters vote Democratic and 66% Republican.
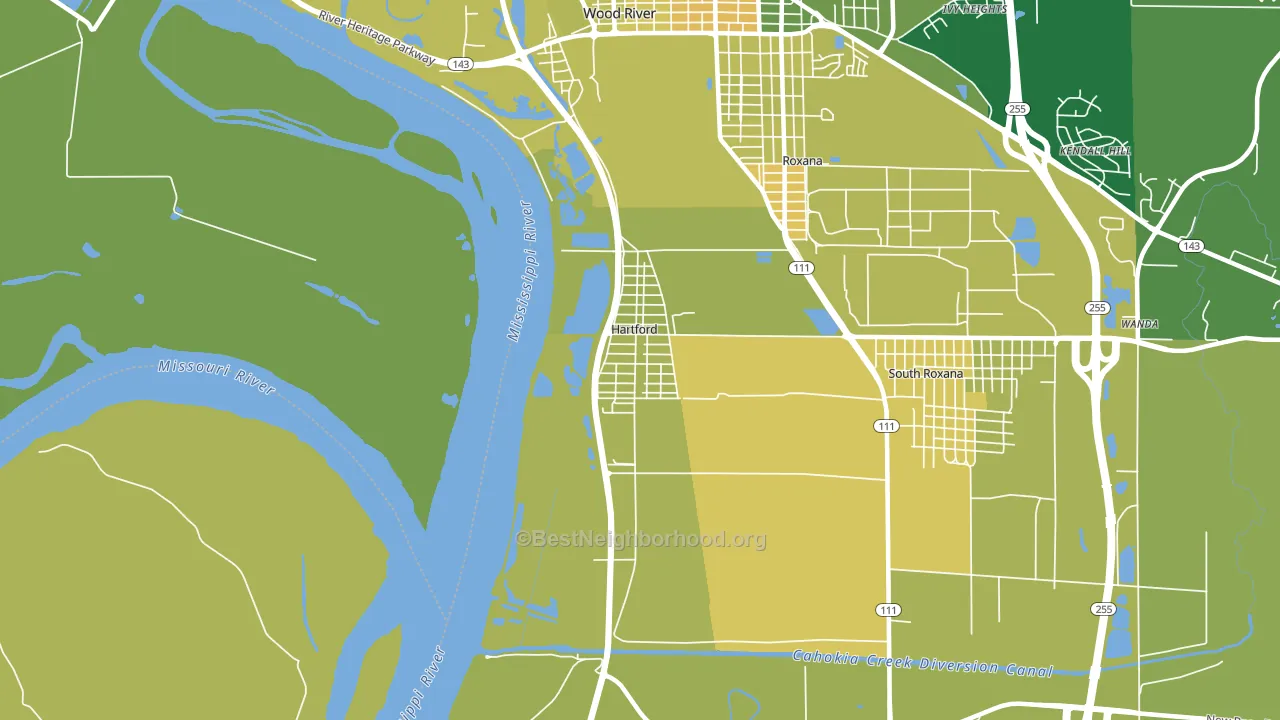
About 64% of adults in Hartford typically vote, near the U.S. average of about 62%. Among adults in Hartford, ~22% vote Democratic, ~42% Republican, and ~36% don't vote. The map below shows estimated turnout by block group.
How Hartford compares
Among cities within 25 miles, Hartford leans more Republican than 122 of 167 neighbors.
Hartford runs about 43 points more Republican than Illinois as a whole. Illinois leans Democratic overall, while Hartford is one of the few Republican-leaning pockets.
Why Hartford leans the way it does
This analysis examined 14,881 data points per city to find what predicts political lean and turnout. The items below are a few correlations that stood out for Hartford, not a ranked or complete list of what matters most.
Hartford votes Republican even though it is densely developed (about 47%, modestly above the Illinois average of 33%). Here an older population outweighs the Democratic lean that density usually predicts. Low college attainment predicts Republican voting, and Hartford sits in the bottom quarter (about 5%, in the bottom fraction of cities). Hartford runs against the grain of Illinois, a Republican-leaning pocket in a Democratic-leaning state.
Paved land cover and Democratic lean
Places with extensive paved surfaces tend to lean Democratic; Hartford, IL sits in the top tenth nationally on this measure. Paved ground does not change how people vote; it mostly reflects how urban and built-up a place is.
Why turnout in Hartford looks the way it does
Turnout in Hartford sits close to the national pattern. Routine healthcare access, homeownership, education, and food security all land near their national averages here. Learn more about the findings and methodology on the political spectrum map.
Nearby Cities
- Roxana, IL R+22
- South Roxana, IL R+38
- Wood River, IL R+20
- East Alton, IL R+20
- Rosewood Heights, IL R+30
- Poag, IL D+4
- Cottage Hills, IL R+24
- Bethalto, IL R+27
- Alton, IL D+11
- Spanish Lake, MO D+74
Cities with Similar Populations
- Spruce Pine, AL R+80
- Prattsville, NY R+17
- Hydes, MD R+26
- Schuyler, VA R+20
- Ashmore, IL R+55
- West Mayfield, PA R+26
- Center, NC R+61
- Athens, LA R+26
- Bitely, MI R+45
- Burns, WY R+64
Sources and methodology
Precinct-level voting records used to fit the model come from Illinois State Board of Elections, distributed by the Voting and Election Science Team. Demographic inputs come from the U.S. Census Bureau (ACS 5-year estimates and the 2020 Decennial Census). Health and environmental inputs come from the CDC (PLACES and the Environmental Justice Index). Land cover comes from the USGS and EPA. Election-day and lead-up weather come from PRISM 4km daily grids and the NOAA Global Historical Climatology Network. Mail-voting and election-administration patterns come from the MIT Election Lab's Survey of the Performance of American Elections. Block-group crime detail comes from CrimeGrade. Internet data and modeling support provided by ISPreports.org.
Modeling and analysis by the BestNeighborhood data science team. Full methodology and findings: political spectrum map.
Methodology reviewed by the BestNeighborhood data team. Last updated May 2026.