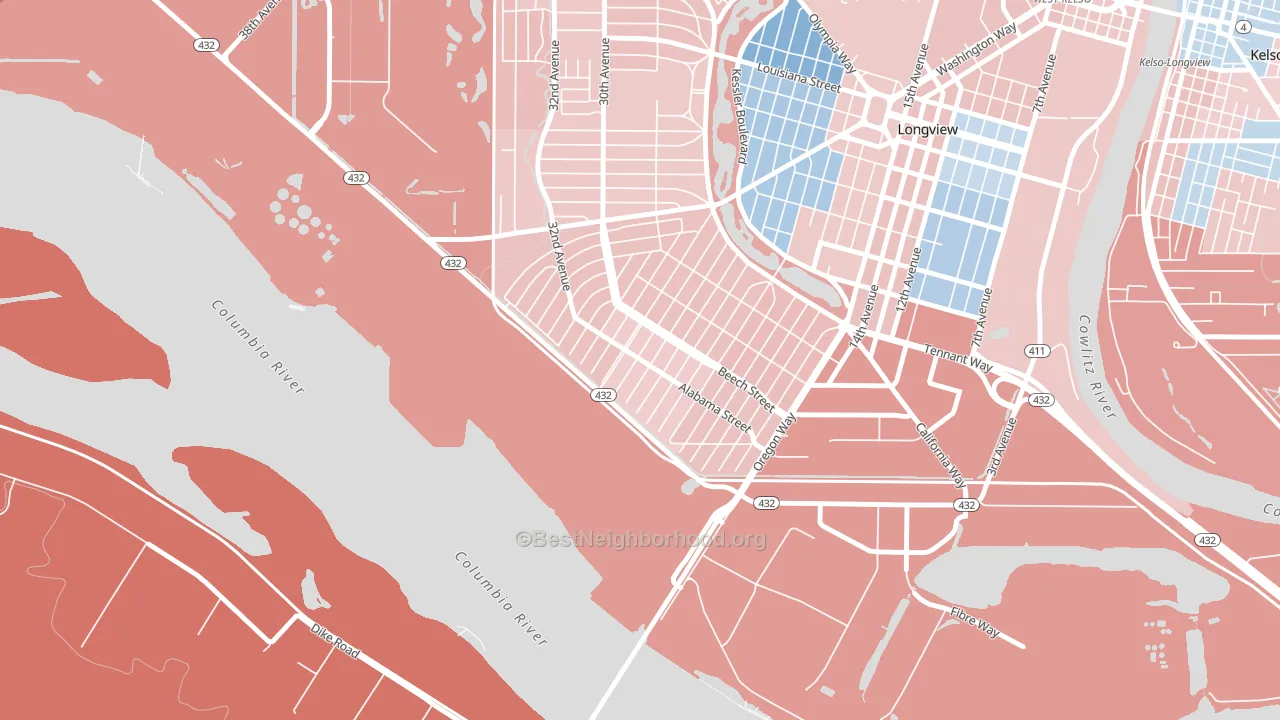
Highlands is a true toss-up. About 48% of voters here vote Democratic and 52% Republican.
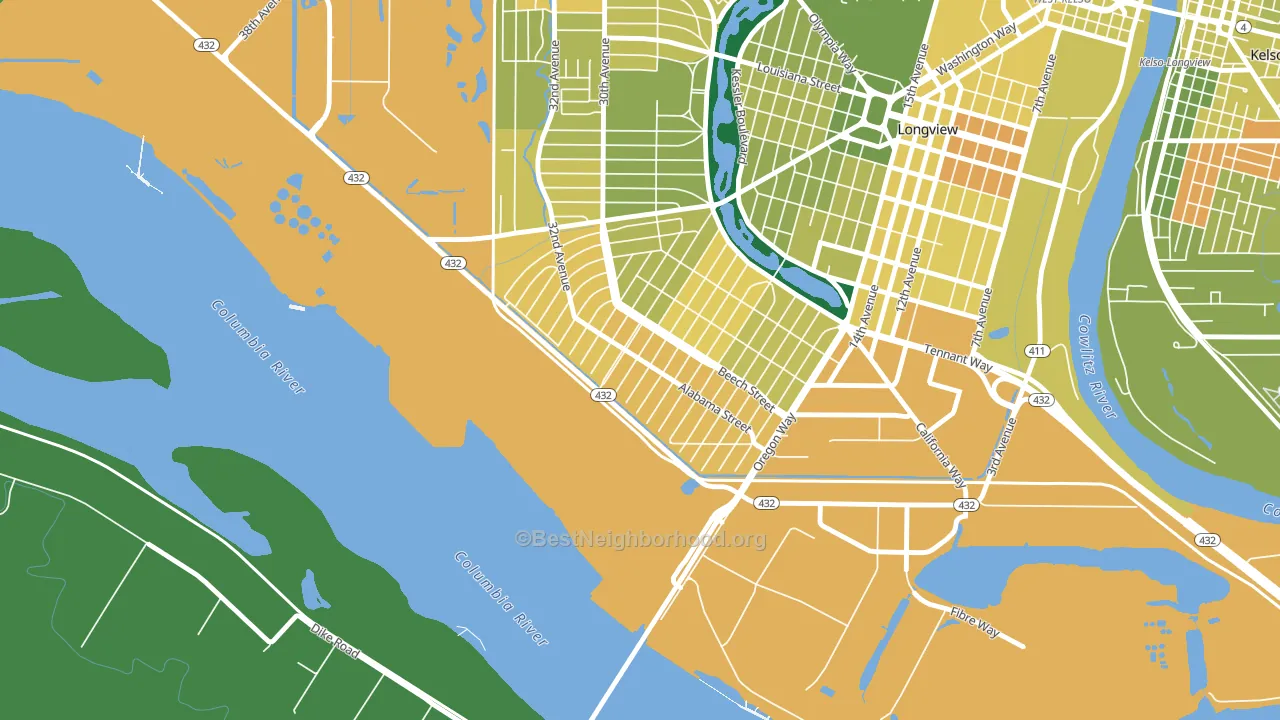
About 43% of adults in Highlands typically vote, below the U.S. average of about 62%. Among adults in Highlands, ~21% vote Democratic, ~22% Republican, and ~57% don't vote. The map below shows estimated turnout by block group.
How Highlands compares
Highlands sits in a sparsely populated area with few comparable neighborhoods nearby.
Highlands runs about 22 points more Republican than Washington as a whole. Washington leans Democratic overall, while Highlands is one of the few Republican-leaning pockets.
Why Highlands leans the way it does
This analysis examined 14,881 data points per neighborhood to find what predicts political lean and turnout. The items below are a few correlations that stood out for Highlands, not a ranked or complete list of what matters most.
Highlands votes against the grain of Washington. Washington leans Democratic overall, while Highlands runs about 22 points more Republican.
Preventive-care access and voter turnout
Places with limited routine preventive-care access tend to turn out at a lower rate; Highlands, Longview, WA sits in the bottom tenth nationally on this measure. Dental visits do not drive turnout; the rate reflects income, insurance, and healthcare access, which line up with who votes.
Why turnout in Highlands looks the way it does
Areas with limited routine healthcare access turn out at lower rates. Highlands is in the bottom quarter nationally for routine-care measures such as insurance coverage, preventive screenings, and dental visits. The dental-visit rate here is about 43%, about 22 points below the Washington average of 65%. Low high-school completion lines up with lower turnout, and about 81% of adults in Highlands have completed high school, below 84% of neighborhoods. High-crime urban areas turn out at lower rates, and Highlands sits in the top 15% on a violent-crime measure. Learn more about the findings and methodology on the political spectrum map.
Nearby Neighborhoods
- Olympic West, Longview, WA R+5
- West Longview, Longview, WA R+17
- Felida-Starcrest, Vancouver, WA D+16
- Starcrest, Salmon Creek, WA D+18
- Pleasant Valley, Vancouver, WA D+7
- Northeast Hazel Dell, Hazel Dell, WA D+18
- West Minnehaha, Vancouver, WA D+18
- Lincoln, Vancouver, WA D+44
- Orchards Area, Orchards, WA Even
- Rose Village, Vancouver, WA D+30
Neighborhoods with Similar Populations
- Downtown Ridgewood, Ridgewood, NJ D+30
- Thornton Park, Santa Ana, CA D+18
- South Shore of Wellington, Wellington, FL R+3
- Tierra Linda, San Antonio, TX D+32
- Belevedere, San Bernardino, CA R+3
- Lost Lake, Clermont, FL R+10
- Washington Court House Historic District, Washington Court H R+44
- Rosemont, Martinsburg, WV R+6
- Coliseum, Oakland, CA D+59
- Meador Park, Springfield, MO R+5
Sources and methodology
Precinct-level voting records used to fit the model come from Washington Secretary of State, Elections, distributed by the Voting and Election Science Team. Demographic inputs come from the U.S. Census Bureau (ACS 5-year estimates and the 2020 Decennial Census). Health and environmental inputs come from the CDC (PLACES and the Environmental Justice Index). Land cover comes from the USGS and EPA. Election-day and lead-up weather come from PRISM 4km daily grids and the NOAA Global Historical Climatology Network. Mail-voting and election-administration patterns come from the MIT Election Lab's Survey of the Performance of American Elections. Block-group crime detail comes from CrimeGrade. Internet data and modeling support provided by ISPreports.org.
Modeling and analysis by the BestNeighborhood data science team. Full methodology and findings: political spectrum map.
Methodology reviewed by the BestNeighborhood data team. Last updated May 2026.