Hot Sulphur Springs leans Republican by roughly 18 points: about 41% of voters vote Democratic and 59% Republican.
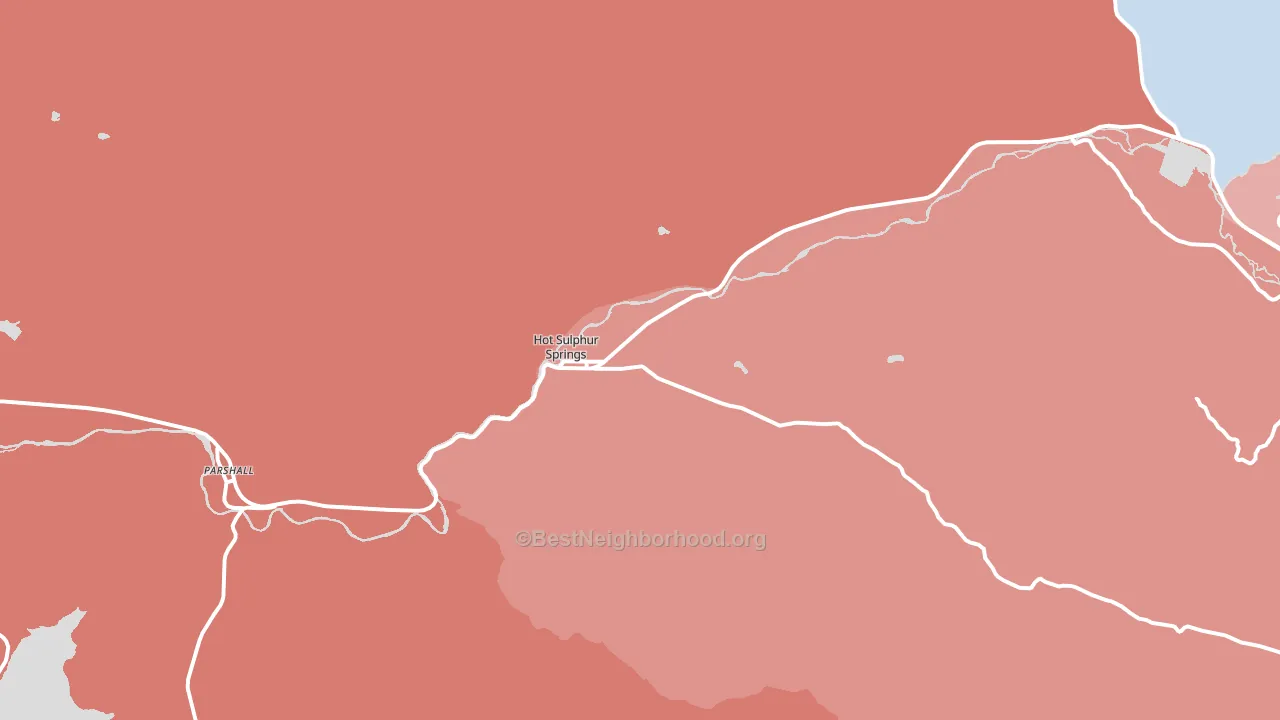
About 78% of adults in Hot Sulphur Springs typically vote, above the U.S. average of about 62%. Among adults in Hot Sulphur Springs, ~32% vote Democratic, ~46% Republican, and ~22% don't vote. The map below shows estimated turnout by block group.
How Hot Sulphur Springs compares
Among cities within 25 miles, Hot Sulphur Springs leans more Republican than 5 of 9 neighbors.
Hot Sulphur Springs runs about 29 points more Republican than Colorado as a whole. Colorado leans Democratic overall, while Hot Sulphur Springs is one of the few Republican-leaning pockets.
Politics vary noticeably by neighborhood within Hot Sulphur Springs. The southwest side is the most Republican-leaning (R+47) and the east side is the least Republican-leaning (R+15), a spread of about 32 points.
Why Hot Sulphur Springs leans the way it does
This analysis examined 14,881 data points per city to find what predicts political lean and turnout. The items below are a few correlations that stood out for Hot Sulphur Springs, not a ranked or complete list of what matters most.
Rural areas vote Republican. About 4% of residents in Hot Sulphur Springs live in densely developed areas, about 31 points below the Colorado average of 35%. A high family-household share predicts Republican voting, and about 81% of households in Hot Sulphur Springs are family households, above 92% of cities. Hot Sulphur Springs runs against the grain of Colorado, a Republican-leaning pocket in a Democratic-leaning state.
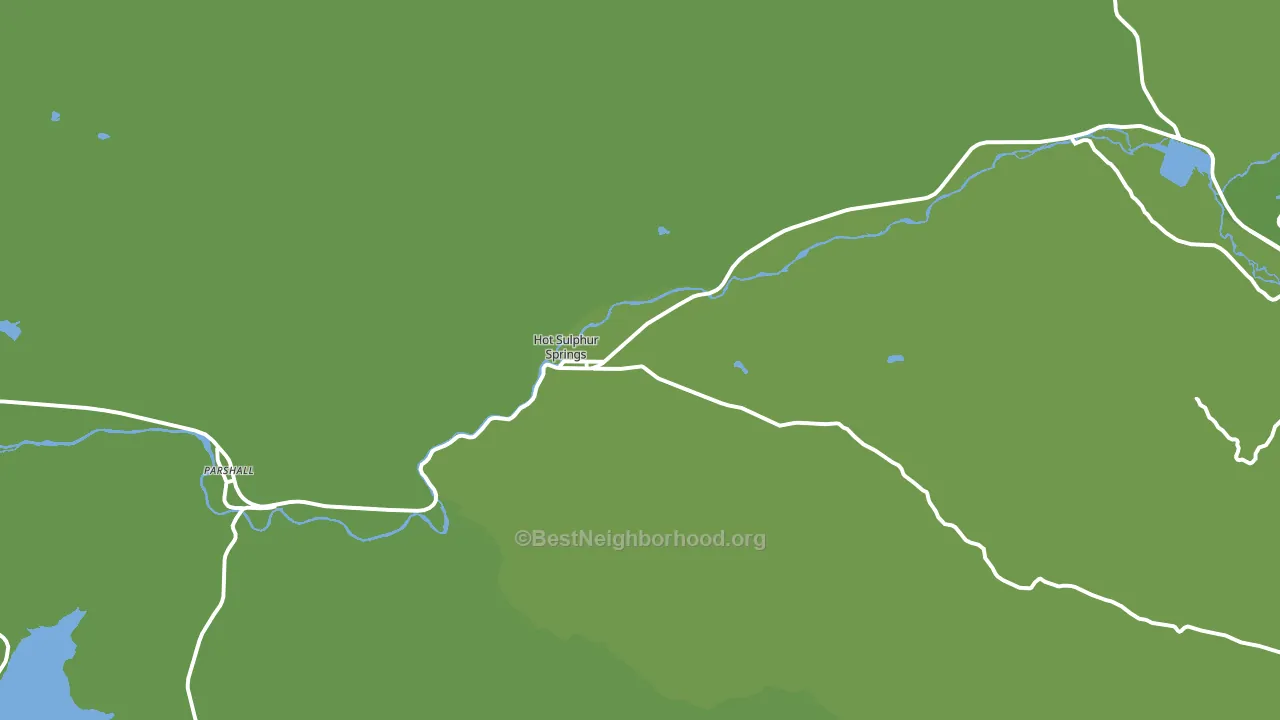
Paved land cover and Republican lean
Places with little paved surface tend to lean Republican; Hot Sulphur Springs, CO sits in the bottom quarter nationally on this measure. Paved ground does not change how people vote; it mostly reflects how urban and built-up a place is.
Why turnout in Hot Sulphur Springs looks the way it does
Areas with high high-school completion turn out at higher rates. About 97% of adults in Hot Sulphur Springs have completed high school, about 7 points above the U.S. average of 90%. Learn more about the findings and methodology on the political spectrum map.
Nearby Cities
- Granby, CO R+3
- Parshall, CO R+45
- Tabernash, CO R+8
- Kremmling, CO R+43
- Grand Lake, CO Even
- Fraser, CO D+21
- Winter Park, CO D+21
- Rand, CO R+42
- Radium, CO R+41
- Silverthorne, CO D+24
Cities with Similar Populations
- St. Francisville, IL R+62
- Forest Glen, CA R+9
- Chemung, NY R+49
- Rankin, TX R+74
- Slate Valley, KY R+60
- St. Rose, IL R+64
- Parker, WA R+8
- Cookstown, NJ R+32
- Jericho, NC R+33
- Standish, CA R+80
Sources and methodology
Precinct-level voting records used to fit the model come from Colorado Secretary of State, Elections, distributed by the Voting and Election Science Team. Demographic inputs come from the U.S. Census Bureau (ACS 5-year estimates and the 2020 Decennial Census). Health and environmental inputs come from the CDC (PLACES and the Environmental Justice Index). Land cover comes from the USGS and EPA. Election-day and lead-up weather come from PRISM 4km daily grids and the NOAA Global Historical Climatology Network. Mail-voting and election-administration patterns come from the MIT Election Lab's Survey of the Performance of American Elections. Block-group crime detail comes from CrimeGrade. Internet data and modeling support provided by ISPreports.org.
Modeling and analysis by the BestNeighborhood data science team. Full methodology and findings: political spectrum map.
Methodology reviewed by the BestNeighborhood data team. Last updated May 2026.