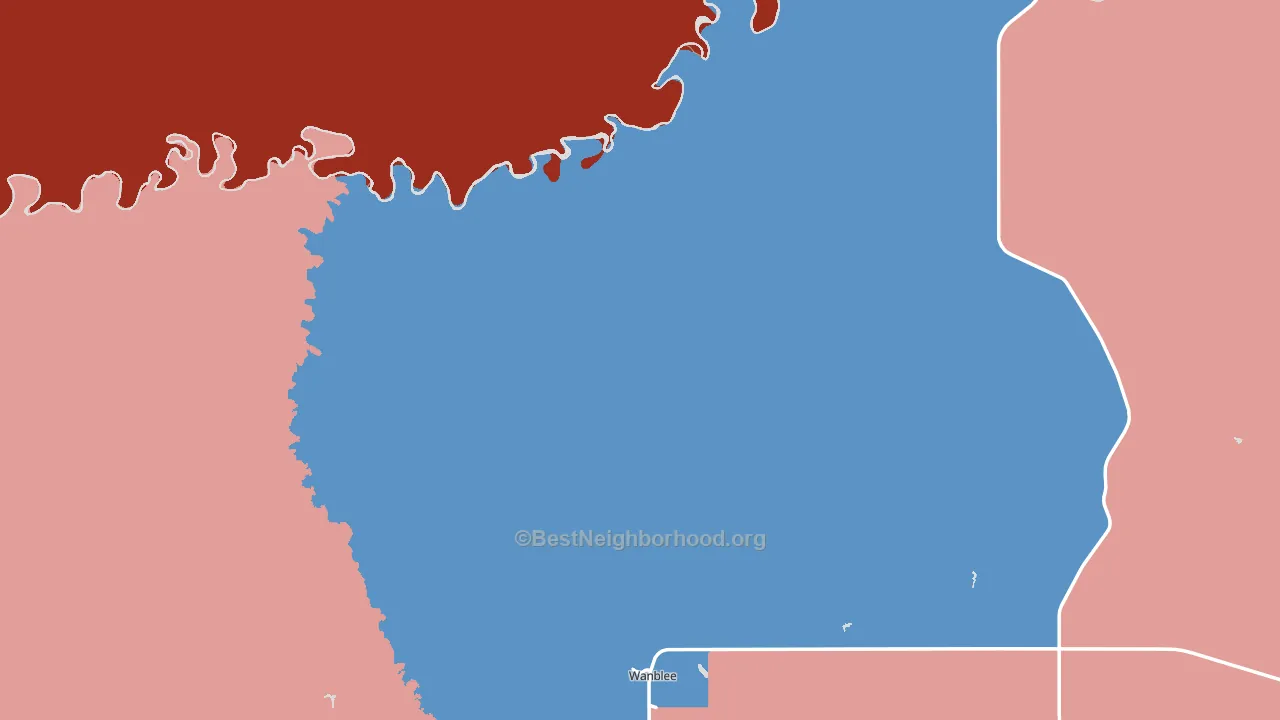
Jackson County leans slightly Republican by roughly 10 points: about 45% of voters vote Democratic and 55% Republican.
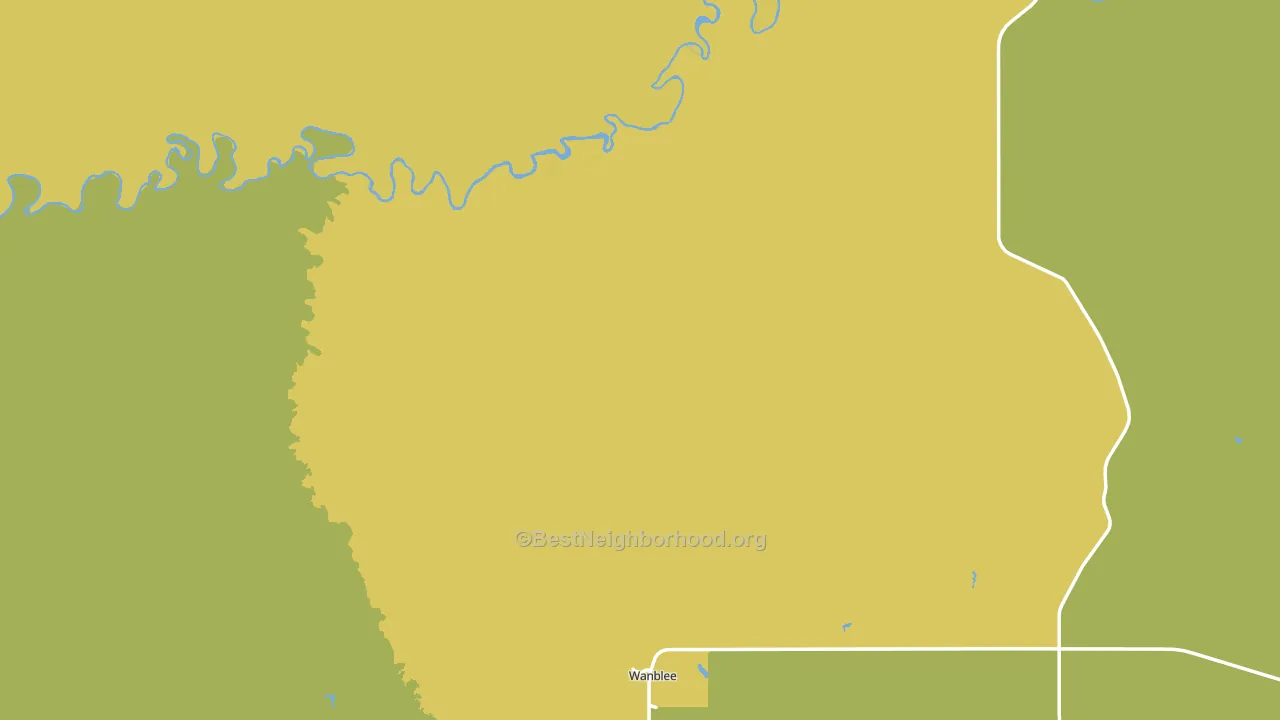
About 59% of adults in Jackson County typically vote, near the U.S. average of about 62%. Among adults in Jackson County, ~27% vote Democratic, ~32% Republican, and ~41% don't vote. The map below shows estimated turnout by block group.
How Jackson County compares
Among counties within 50 miles, Jackson County leans more Republican than 1 of 3 neighbors.
Jackson County runs about 20 points more Democratic than South Dakota as a whole.
Politics vary noticeably by city within Jackson County. The south side runs the most Democratic (D+43) and the northwest side runs the most Republican (R+73), a spread of about 116 points.
Why Jackson County leans the way it does
This analysis examined 14,881 data points per county to find what predicts political lean and turnout. The items below are a few correlations that stood out for Jackson County, not a ranked or complete list of what matters most.
Areas with low college attainment vote Republican. About 13% of adults in Jackson County hold a bachelor's degree, about 13 points below the South Dakota average of 26%. Rural areas vote Republican, and Jackson County sits in the bottom quarter on density (about 2%, below 98% of counties). A high family-household share predicts Republican voting, and about 73% of households in Jackson County are family households, above 92% of counties.
Population density, never-married share, and Republican lean
Places that combine low population density and a never-married-heavy adult population tend to lean Republican, as Jackson County, SD does.
Why turnout in Jackson County looks the way it does
Areas with limited routine healthcare access turn out at lower rates. Jackson County is in the bottom quarter nationally for routine-care measures such as insurance coverage, preventive screenings, and dental visits. Renters vote less often than owners, and about 32% of households in Jackson County rent, above 80% of counties. High-crime urban areas turn out at lower rates, and Jackson County sits in the top 15% on a violent-crime measure. Learn more about the findings and methodology on the political spectrum map.
Nearby Counties
- Bennett County, SD R+7
- Haakon County, SD R+71
- Mellette County, SD R+25
- Jones County, SD R+72
- Todd County, SD D+57
- Sheridan County, NE R+68
- Cherry County, NE R+67
- Stanley County, SD R+49
- Pennington County, SD R+28
- Hughes County, SD R+34
Counties with Similar Populations
- Trego County, KS R+67
- Hall County, TX R+63
- Sherman County, TX R+69
- Douglas County, SD R+68
- Perkins County, SD R+68
- Decatur County, KS R+65
- Clay County, GA D+18
- Logan County, KS R+67
- Real County, TX R+64
- Perkins County, NE R+76
Sources and methodology
Precinct-level voting records used to fit the model come from South Dakota Secretary of State, Elections, distributed by the Voting and Election Science Team. Demographic inputs come from the U.S. Census Bureau (ACS 5-year estimates and the 2020 Decennial Census). Health and environmental inputs come from the CDC (PLACES and the Environmental Justice Index). Land cover comes from the USGS and EPA. Election-day and lead-up weather come from PRISM 4km daily grids and the NOAA Global Historical Climatology Network. Mail-voting and election-administration patterns come from the MIT Election Lab's Survey of the Performance of American Elections. Block-group crime detail comes from CrimeGrade. Internet data and modeling support provided by ISPreports.org.
Modeling and analysis by the BestNeighborhood data science team. Full methodology and findings: political spectrum map.
Methodology reviewed by the BestNeighborhood data team. Last updated May 2026.