Johnnie leans heavily Republican by roughly 42 points: about 29% of voters vote Democratic and 71% Republican.
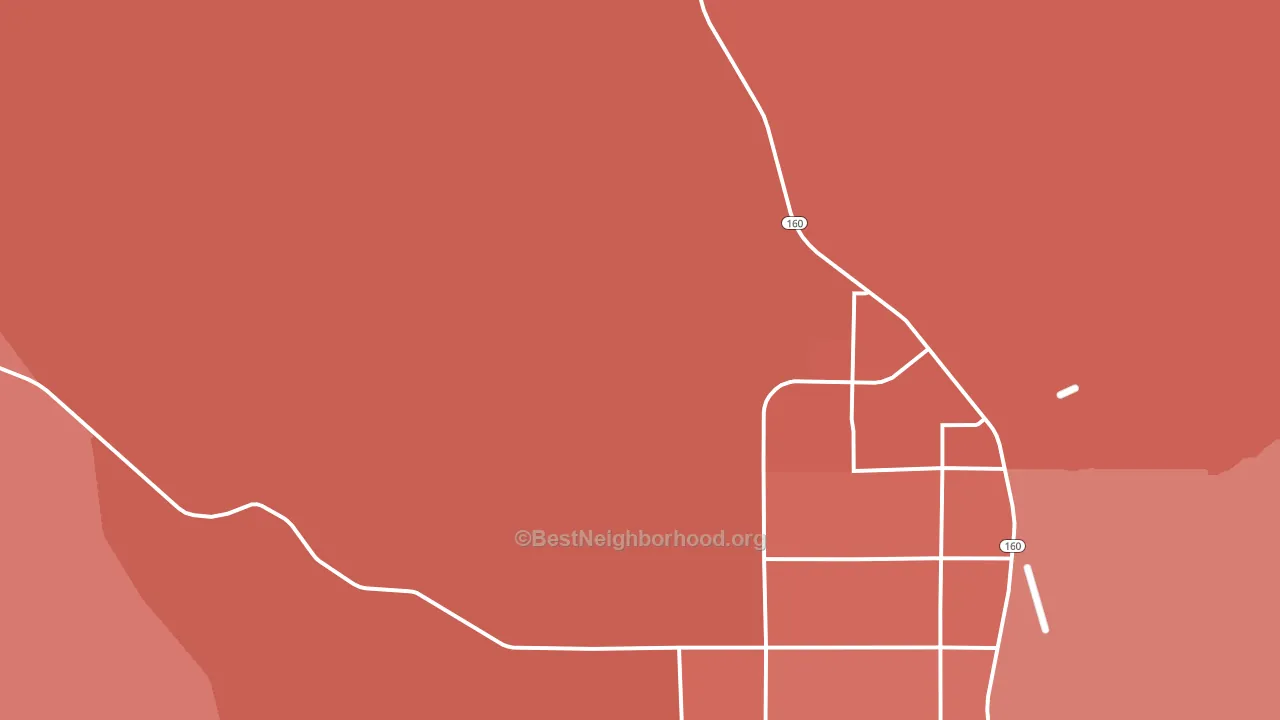
About 54% of adults in Johnnie typically vote, below the U.S. average of about 62%. Among adults in Johnnie, ~16% vote Democratic, ~39% Republican, and ~45% don't vote. The map below shows estimated turnout by block group.
How Johnnie compares
Among cities within 25 miles, Johnnie leans more Republican than 3 of 4 neighbors.
Johnnie runs about 40 points more Republican than Nevada as a whole.
Why Johnnie leans the way it does
This analysis examined 14,881 data points per city to find what predicts political lean and turnout. The items below are a few correlations that stood out for Johnnie, not a ranked or complete list of what matters most.
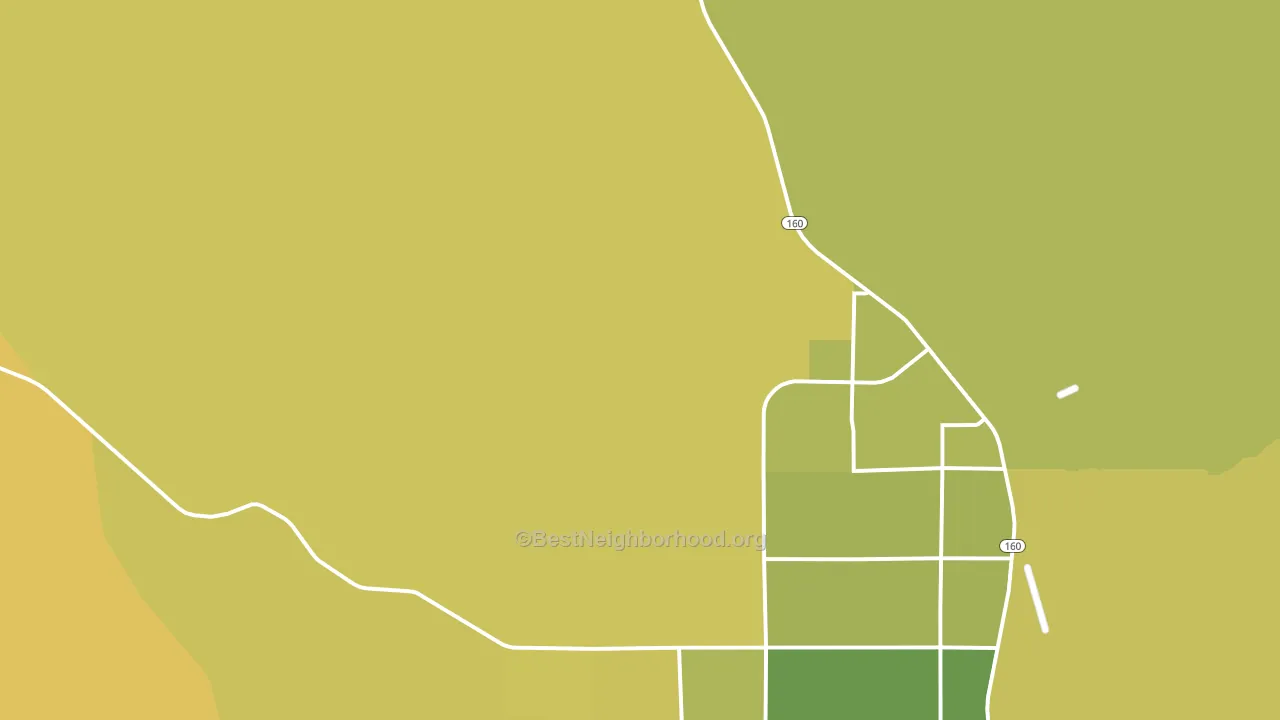
Rural areas vote Republican. About 1% of residents in Johnnie live in densely developed areas, about 43 points below the Nevada average of 44%. Low college attainment predicts Republican voting, and Johnnie sits in the bottom quarter (about 6%, below 98% of cities).
Developed land and Republican lean
Places with a rural land-use pattern tend to lean Republican; Johnnie, NV sits in the bottom tenth nationally on this measure. Developed land does not change how people vote; it mostly reflects how urban a place is.
Why turnout in Johnnie looks the way it does
Areas with limited routine healthcare access turn out at lower rates. Johnnie is in the bottom quarter nationally for routine-care measures such as insurance coverage, preventive screenings, and dental visits. Low high-school completion lines up with lower turnout, and about 83% of adults in Johnnie have completed high school, below 85% of cities. Learn more about the findings and methodology on the political spectrum map.
Nearby Cities
- Pahrump, NV R+39
- Manse, NV R+47
- Dry Lake, NV R+27
- Amargosa Valley, NV R+36
- Tecopa, CA D+15
- Indian Springs, NV R+14
- Death Valley Junction, CA D+16
- Blue Diamond, NV R+19
- Sandy Valley, NV R+45
Cities with Similar Populations
- Sterlington, NY R+11
- Pulpit Harbor, ME D+24
- Highland Heights, TN R+66
- Hillsboro, PA R+57
- Paul, NE R+50
- La Mesilla, NM D+58
- Hicks, LA R+86
- Hopson, KY R+62
- Genoa, CO R+59
- Lima, MT R+63
Sources and methodology
Precinct-level voting records used to fit the model come from Nevada Secretary of State, Elections, distributed by the Voting and Election Science Team. Demographic inputs come from the U.S. Census Bureau (ACS 5-year estimates and the 2020 Decennial Census). Health and environmental inputs come from the CDC (PLACES and the Environmental Justice Index). Land cover comes from the USGS and EPA. Election-day and lead-up weather come from PRISM 4km daily grids and the NOAA Global Historical Climatology Network. Mail-voting and election-administration patterns come from the MIT Election Lab's Survey of the Performance of American Elections. Block-group crime detail comes from CrimeGrade. Internet data and modeling support provided by ISPreports.org.
Modeling and analysis by the BestNeighborhood data science team. Full methodology and findings: political spectrum map.
Methodology reviewed by the BestNeighborhood data team. Last updated May 2026.