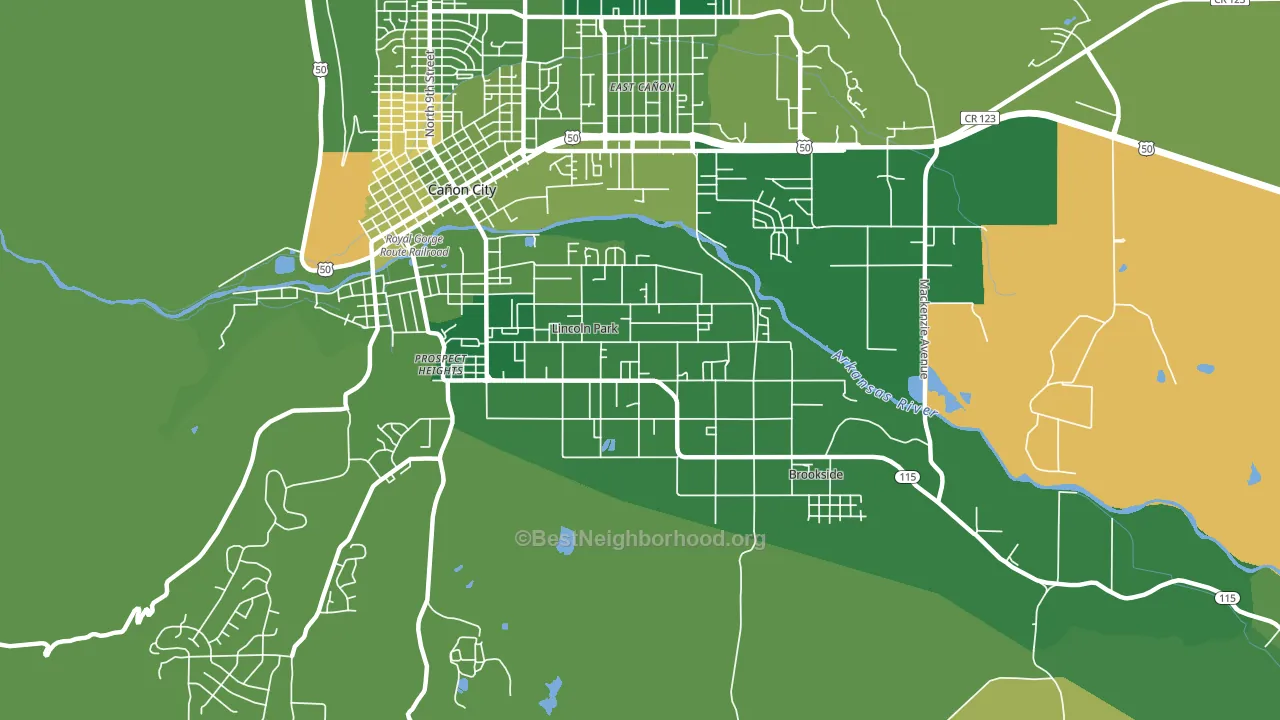
Lincoln Park leans Republican by roughly 28 points: about 36% of voters vote Democratic and 64% Republican.
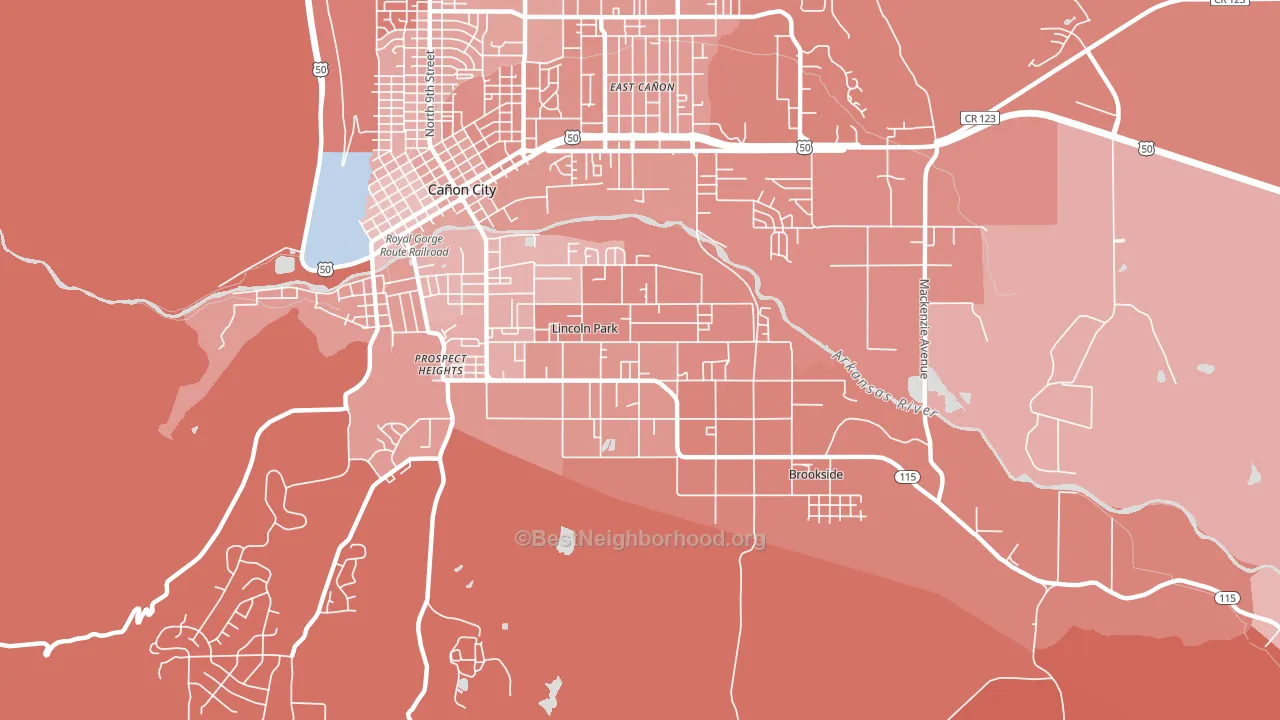
About 90% of adults in Lincoln Park typically vote, above the U.S. average of about 62%. Among adults in Lincoln Park, ~32% vote Democratic, ~58% Republican, and ~10% don't vote. The map below shows estimated turnout by block group.
How Lincoln Park compares
Among cities within 25 miles, Lincoln Park leans more Republican than 6 of 21 neighbors.
Lincoln Park runs about 39 points more Republican than Colorado as a whole. Colorado leans Democratic overall, while Lincoln Park is one of the few Republican-leaning pockets.
Politics vary noticeably by neighborhood within Lincoln Park. The southeast side is the most Republican-leaning (R+33) and the northwest side is the least Republican-leaning (R+15), a spread of about 18 points.
Why Lincoln Park leans the way it does
This analysis examined 14,881 data points per city to find what predicts political lean and turnout. The items below are a few correlations that stood out for Lincoln Park, not a ranked or complete list of what matters most.
Lincoln Park votes Republican even though it is densely developed (about 73%, far above the Colorado average of 35%). Here an older population outweighs the Democratic lean that density usually predicts. Lincoln Park runs against the grain of Colorado, a Republican-leaning pocket in a Democratic-leaning state.
Population density and Democratic lean
Places with high population density tend to lean Democratic; Lincoln Park, CO sits in the top quarter nationally on this measure.
Why turnout in Lincoln Park looks the way it does
Areas with high high-school completion turn out at higher rates. About 98% of adults in Lincoln Park have completed high school, about 5 points above the Colorado average of 93%. Learn more about the findings and methodology on the political spectrum map.
Nearby Cities
- Brookside, CO R+34
- Canon City, CO R+22
- Williamsburg, CO R+12
- Rockvale, CO R+53
- Park Center, CO R+36
- Florence, CO R+17
- Prospect Heights, CO R+41
- Buckskin Joe, CO R+42
- Penrose, CO R+42
- Portland, CO R+47
Cities with Similar Populations
- Falmouth, MA D+47
- Keeseville, NY R+14
- Northlake, SC R+39
- Corning, AR R+58
- Saddle River, NJ R+17
- Little Compton, RI D+9
- Castle Hills, TX D+3
- North Baltimore, OH R+43
- North Barrington, IL D+6
- Las Animas, CO R+19
Sources and methodology
Precinct-level voting records used to fit the model come from Colorado Secretary of State, Elections, distributed by the Voting and Election Science Team. Demographic inputs come from the U.S. Census Bureau (ACS 5-year estimates and the 2020 Decennial Census). Health and environmental inputs come from the CDC (PLACES and the Environmental Justice Index). Land cover comes from the USGS and EPA. Election-day and lead-up weather come from PRISM 4km daily grids and the NOAA Global Historical Climatology Network. Mail-voting and election-administration patterns come from the MIT Election Lab's Survey of the Performance of American Elections. Block-group crime detail comes from CrimeGrade. Internet data and modeling support provided by ISPreports.org.
Modeling and analysis by the BestNeighborhood data science team. Full methodology and findings: political spectrum map.
Methodology reviewed by the BestNeighborhood data team. Last updated May 2026.