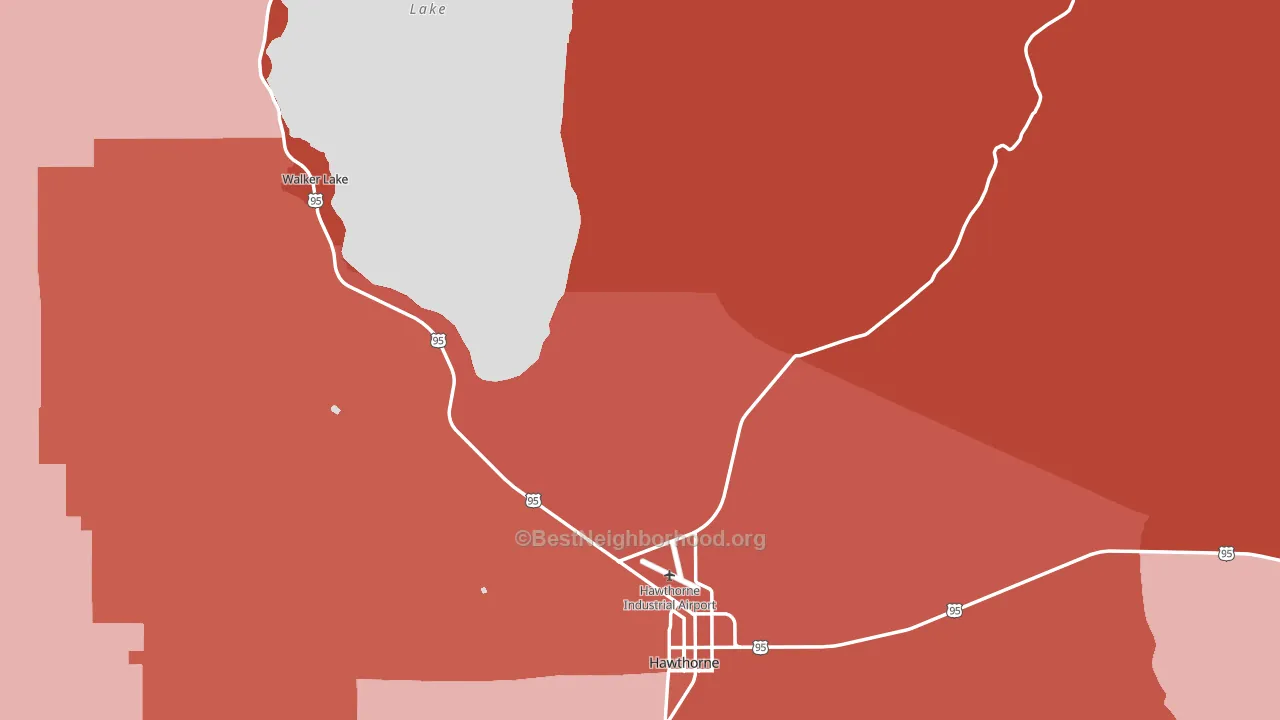
Mineral County leans heavily Republican by roughly 40 points: about 30% of voters vote Democratic and 70% Republican.
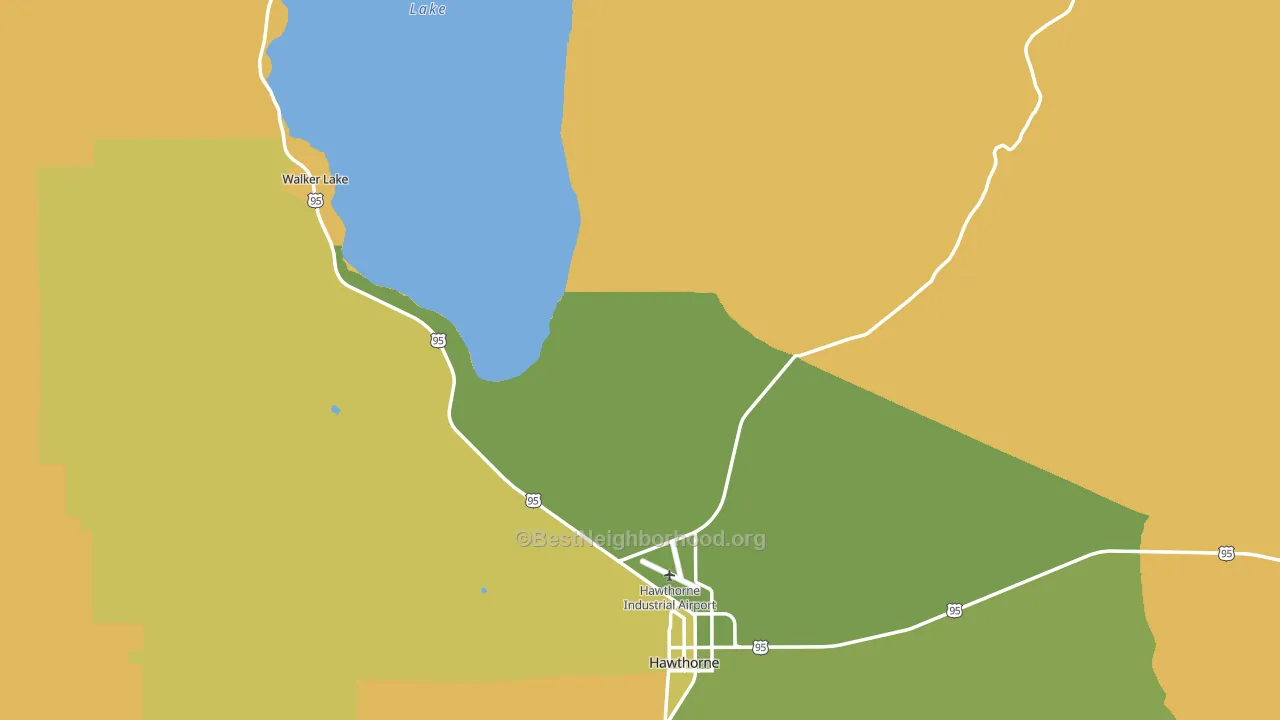
About 55% of adults in Mineral County typically vote, below the U.S. average of about 62%. Among adults in Mineral County, ~16% vote Democratic, ~39% Republican, and ~45% don't vote. The map below shows estimated turnout by block group.
How Mineral County compares
Mineral County runs about 37 points more Republican than Nevada as a whole.
Politics vary noticeably by city within Mineral County. The west side is the most Republican-leaning (R+50) and the southwest side is the least Republican-leaning (R+7), a spread of about 43 points.
Why Mineral County leans the way it does
This analysis examined 14,881 data points per county to find what predicts political lean and turnout. The items below are a few correlations that stood out for Mineral County, not a ranked or complete list of what matters most.
Areas with low college attainment vote Republican. About 13% of adults in Mineral County hold a bachelor's degree, about 12 points below the Nevada average of 25%.
Population density and Republican lean
Places with low population density tend to lean Republican; Mineral County, NV sits in the bottom tenth nationally on this measure.
Why turnout in Mineral County looks the way it does
Areas with limited routine healthcare access turn out at lower rates. Mineral County is in the bottom quarter nationally for routine-care measures such as insurance coverage, preventive screenings, and dental visits. High food insecurity lines up with lower turnout, and about 24% of adults in Mineral County report food insecurity, above 86% of counties. Learn more about the findings and methodology on the political spectrum map.
Nearby Counties
- Mono County, CA D+13
- Churchill County, NV R+44
- Lyon County, NV R+42
- Douglas County, NV R+32
- Alpine County, CA D+36
- Carson City, NV R+11
- Storey County, NV R+40
- Esmeralda County, NV R+61
- Washoe County, NV D+3
- Inyo County, CA R+4
Counties with Similar Populations
- Morrill County, NE R+64
- Florence County, WI R+41
- Schley County, GA R+60
- Cameron County, PA R+47
- Oneida County, ID R+76
- Mineral County, MT R+53
- Phillips County, CO R+53
- Hickman County, KY R+61
- Hyde County, NC R+25
- Lincoln County, NV R+66
Sources and methodology
Precinct-level voting records used to fit the model come from Nevada Secretary of State, Elections, distributed by the Voting and Election Science Team. Demographic inputs come from the U.S. Census Bureau (ACS 5-year estimates and the 2020 Decennial Census). Health and environmental inputs come from the CDC (PLACES and the Environmental Justice Index). Land cover comes from the USGS and EPA. Election-day and lead-up weather come from PRISM 4km daily grids and the NOAA Global Historical Climatology Network. Mail-voting and election-administration patterns come from the MIT Election Lab's Survey of the Performance of American Elections. Block-group crime detail comes from CrimeGrade. Internet data and modeling support provided by ISPreports.org.
Modeling and analysis by the BestNeighborhood data science team. Full methodology and findings: political spectrum map.
Methodology reviewed by the BestNeighborhood data team. Last updated May 2026.