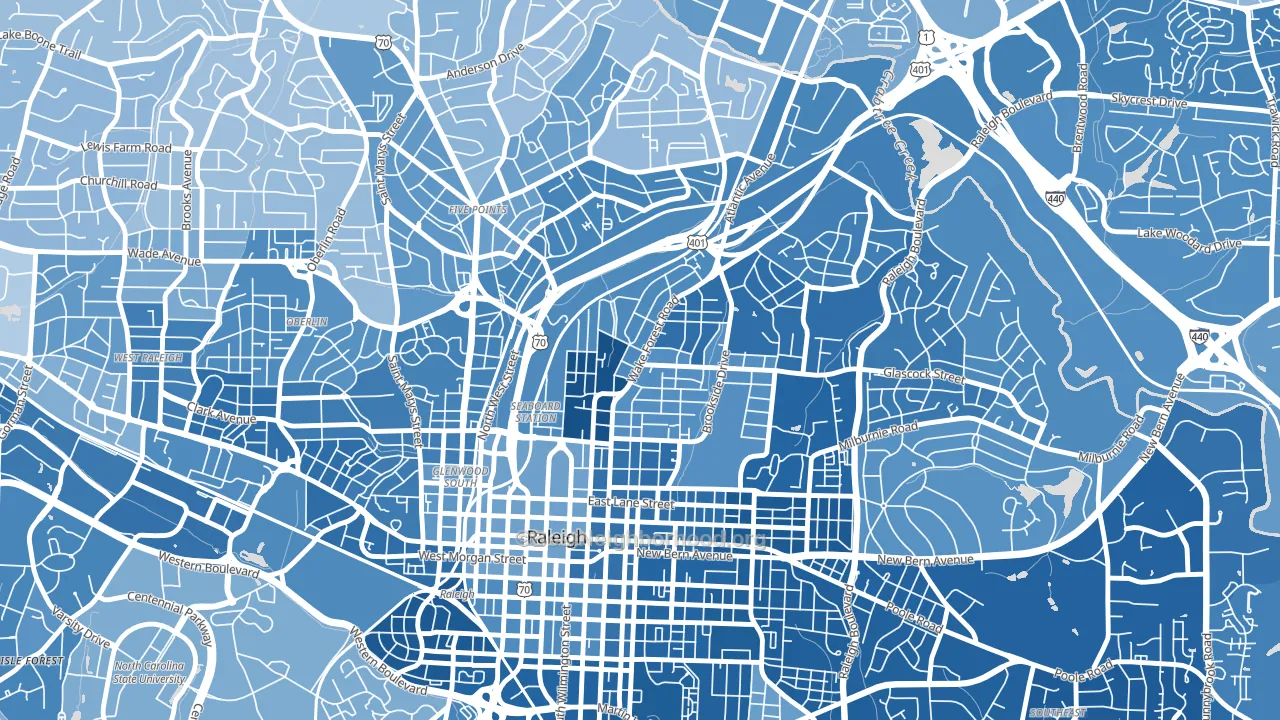
Mordecai is a Democratic stronghold. About 81% of voters here vote Democratic and 19% Republican.
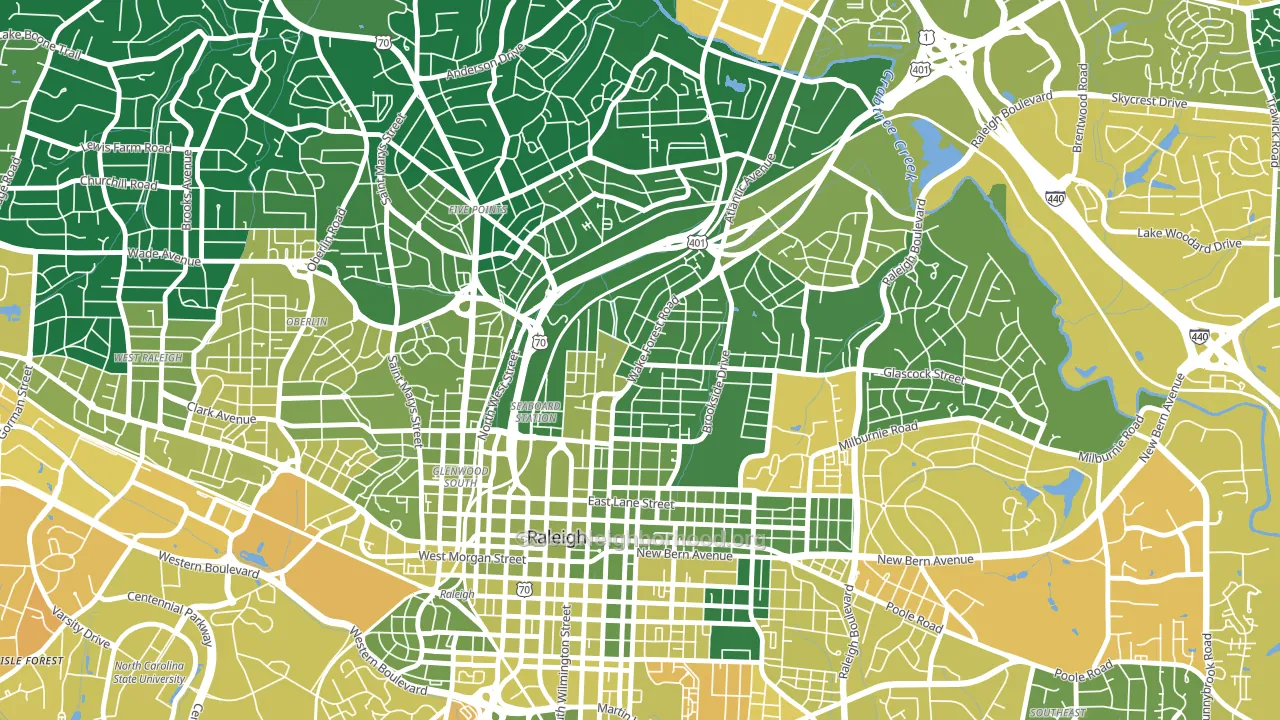
About 87% of adults in Mordecai typically vote, above the U.S. average of about 62%. Among adults in Mordecai, ~71% vote Democratic, ~16% Republican, and ~13% don't vote. The map below shows estimated turnout by block group.
How Mordecai compares
Among neighborhoods within 5 miles, Mordecai leans more Democratic than 8 of 14 neighbors.
Mordecai runs about 65 points more Democratic than North Carolina as a whole. North Carolina leans Republican overall, while Mordecai is one of the few Democratic-leaning pockets.
Politics vary noticeably by block within Mordecai. The southwest side is the most Democratic-leaning (D+78) and the southeast side is the least Democratic-leaning (D+51), a spread of about 27 points.
Why Mordecai leans the way it does
This analysis examined 14,881 data points per neighborhood to find what predicts political lean and turnout. The items below are a few correlations that stood out for Mordecai, not a ranked or complete list of what matters most.
Areas with high college attainment vote Democratic. About 77% of adults in Mordecai hold a bachelor's degree, about 48 points above the U.S. average of 28%. Mordecai runs against the grain of North Carolina, a Democratic-leaning pocket in a Republican-leaning state.
Park access and Democratic lean
Places with heavy park coverage tend to lean Democratic; Mordecai, Raleigh, NC sits in the top quarter nationally on this measure. Park access does not change how people vote; it tends to track denser, higher-income areas.
Why turnout in Mordecai looks the way it does
Areas with high high-school completion turn out at higher rates. About 98% of adults in Mordecai have completed high school, about 9 points above the North Carolina average of 88%. Learn more about the findings and methodology on the political spectrum map.
Nearby Neighborhoods
- North Central, Raleigh, NC D+67
- Five Points, Raleigh, NC D+38
- Central, Raleigh, NC D+65
- South Central, Raleigh, NC D+69
- East Raleigh, Raleigh, NC D+64
- Hillsborough, Raleigh, NC D+55
- Wade, Raleigh, NC D+44
- Glenwood, Raleigh, NC D+19
- Six Forks, Raleigh, NC D+27
- Falls of Neuse, Raleigh, NC D+31
Neighborhoods with Similar Populations
- Franz Park, St. Louis, MO D+53
- Monterey Lakes, Largo, FL R+10
- Happy Hollow, Valley Falls, RI Even
- Gentilly Woods, New Orleans, LA D+73
- Wyndmoor, Glenside, PA D+57
- Claremont, Mobile, AL R+18
- Homeland, Baltimore, MD D+67
- Three Points, Columbia, SC D+59
- Artisan, Bakersfield, CA R+6
- Lake Floresta Park, Boca Raton, FL R+7
Sources and methodology
Precinct-level voting records used to fit the model come from North Carolina State Board of Elections, distributed by the Voting and Election Science Team. Demographic inputs come from the U.S. Census Bureau (ACS 5-year estimates and the 2020 Decennial Census). Health and environmental inputs come from the CDC (PLACES and the Environmental Justice Index). Land cover comes from the USGS and EPA. Election-day and lead-up weather come from PRISM 4km daily grids and the NOAA Global Historical Climatology Network. Mail-voting and election-administration patterns come from the MIT Election Lab's Survey of the Performance of American Elections. Block-group crime detail comes from CrimeGrade. Internet data and modeling support provided by ISPreports.org.
Modeling and analysis by the BestNeighborhood data science team. Full methodology and findings: political spectrum map.
Methodology reviewed by the BestNeighborhood data team. Last updated May 2026.