Mount Enterprise is a Republican stronghold. About 21% of voters here vote Democratic and 79% Republican.
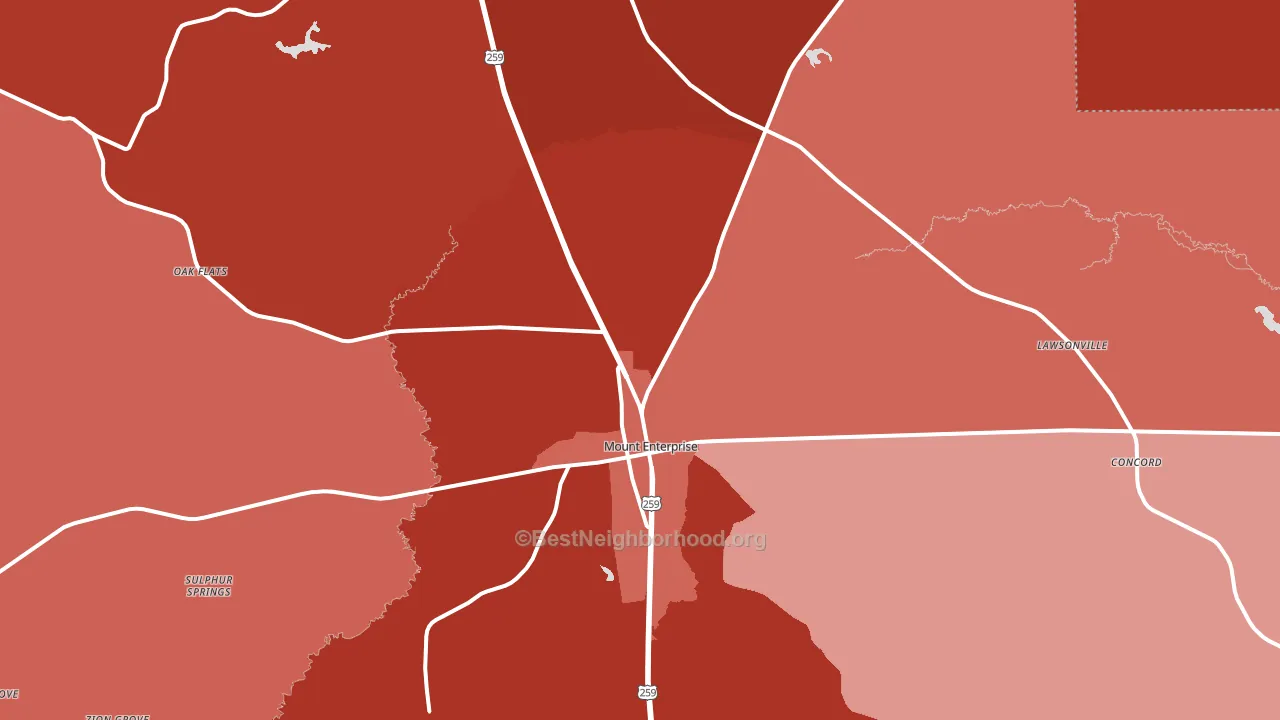
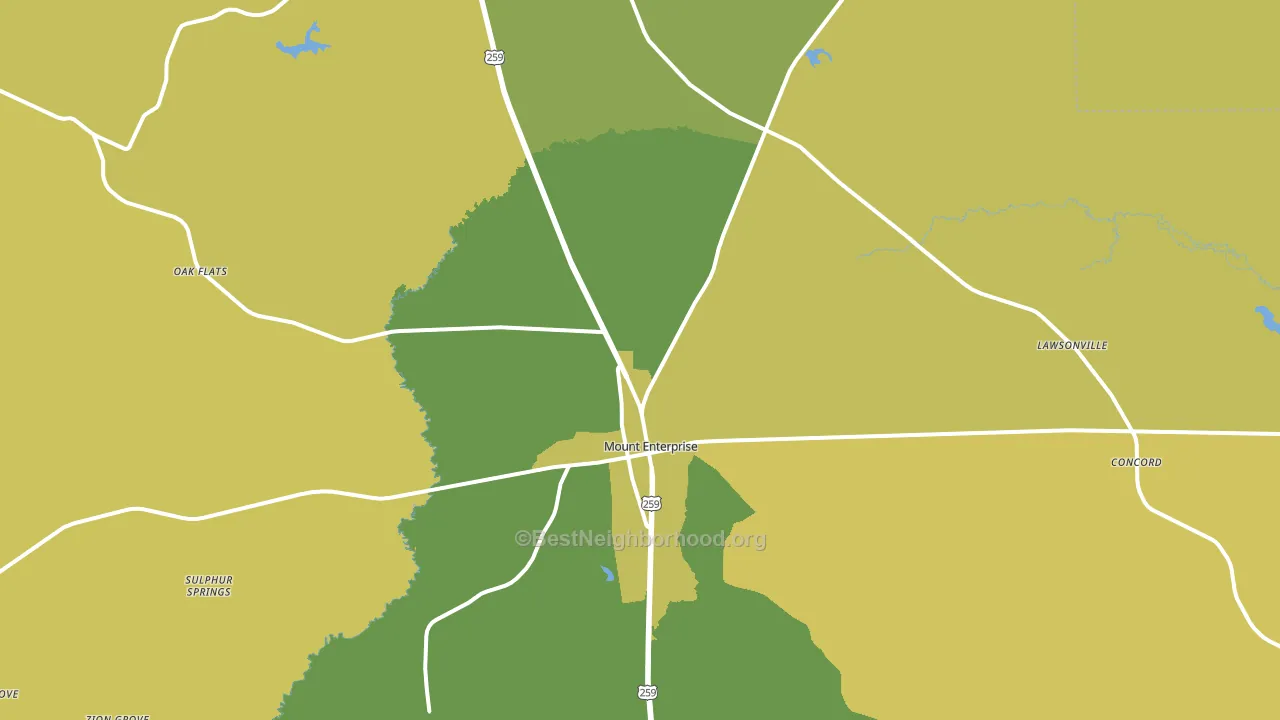
About 65% of adults in Mount Enterprise typically vote, near the U.S. average of about 62%. Among adults in Mount Enterprise, ~14% vote Democratic, ~52% Republican, and ~34% don't vote. The map below shows estimated turnout by block group.
How Mount Enterprise compares
Among cities within 25 miles, Mount Enterprise leans more Republican than 11 of 44 neighbors.
Mount Enterprise runs about 44 points more Republican than Texas as a whole.
Politics vary noticeably by neighborhood within Mount Enterprise. The northwest side is the most Republican-leaning (R+78) and the east side is the least Republican-leaning (R+35), a spread of about 42 points.
Why Mount Enterprise leans the way it does
This analysis examined 14,881 data points per city to find what predicts political lean and turnout. The items below are a few correlations that stood out for Mount Enterprise, not a ranked or complete list of what matters most.
Areas with low college attainment vote Republican. About 15% of adults in Mount Enterprise hold a bachelor's degree, about 11 points below the Texas average of 26%.
Park access and Republican lean
Places with low park coverage tend to lean Republican; Mount Enterprise, TX sits in the bottom tenth nationally on this measure. Park access does not change how people vote; it tends to track denser, higher-income areas.
Why turnout in Mount Enterprise looks the way it does
Areas with limited routine healthcare access turn out at lower rates. Mount Enterprise is in the bottom quarter nationally for routine-care measures such as insurance coverage, preventive screenings, and dental visits. Learn more about the findings and methodology on the political spectrum map.
Nearby Cities
- Oak Flat, TX R+66
- Glenfawn, TX R+41
- Long Branch, TX R+66
- Laneville, TX R+62
- Fitze, TX R+78
- Minden, TX R+79
- Garrison, TX R+56
- Nat, TX R+72
- Cushing, TX R+73
- Pone, TX R+61
Cities with Similar Populations
- Uvalda, GA R+73
- New Llano, LA R+14
- Union, OR R+52
- Wartrace, IL D+13
- Tivoli, NY D+28
- Shell Knob, MO R+56
- Darrington, WA R+26
- Country Club, MO R+35
- Piperton, TN R+39
- Queen City, TX R+59
Sources and methodology
Precinct-level voting records used to fit the model come from Texas Secretary of State, Elections Division, distributed by the Voting and Election Science Team. Demographic inputs come from the U.S. Census Bureau (ACS 5-year estimates and the 2020 Decennial Census). Health and environmental inputs come from the CDC (PLACES and the Environmental Justice Index). Land cover comes from the USGS and EPA. Election-day and lead-up weather come from PRISM 4km daily grids and the NOAA Global Historical Climatology Network. Mail-voting and election-administration patterns come from the MIT Election Lab's Survey of the Performance of American Elections. Block-group crime detail comes from CrimeGrade. Internet data and modeling support provided by ISPreports.org.
Modeling and analysis by the BestNeighborhood data science team. Full methodology and findings: political spectrum map.
Methodology reviewed by the BestNeighborhood data team. Last updated May 2026.