New Bethlehem is a Republican stronghold. About 19% of voters here vote Democratic and 81% Republican.
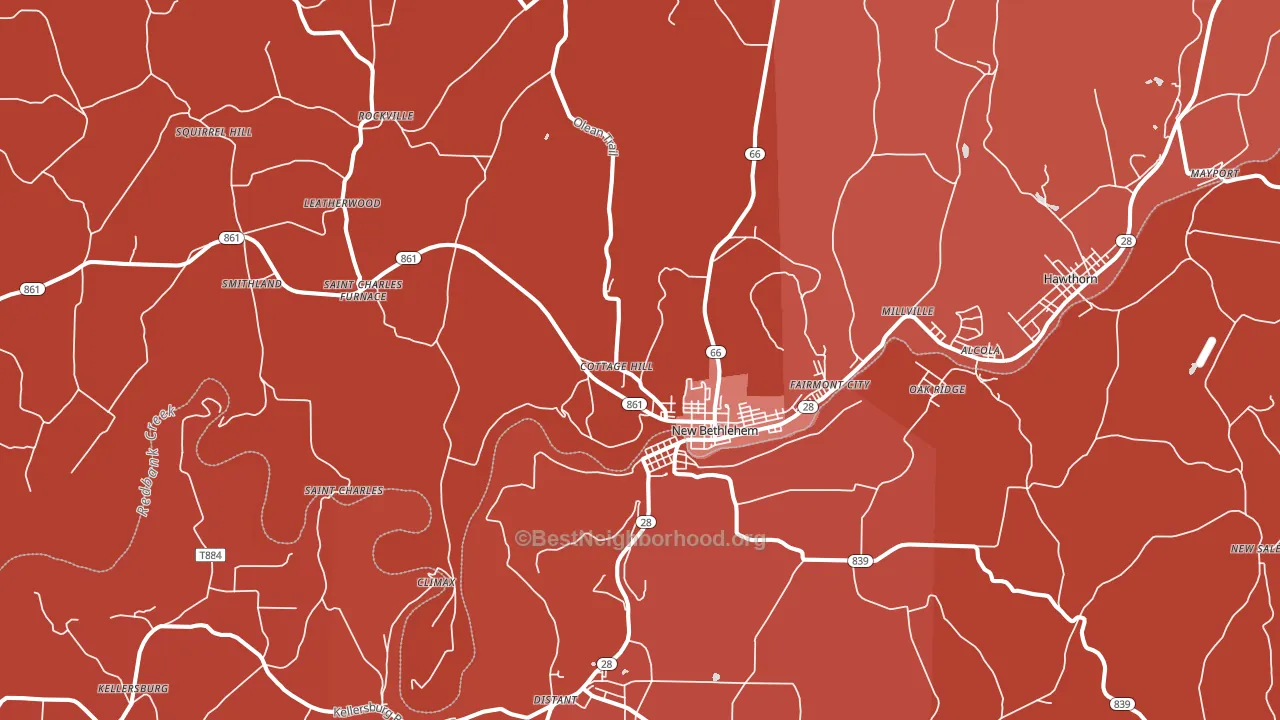
About 70% of adults in New Bethlehem typically vote, above the U.S. average of about 62%. Among adults in New Bethlehem, ~13% vote Democratic, ~57% Republican, and ~30% don't vote. The map below shows estimated turnout by block group.
How New Bethlehem compares
Among cities within 25 miles, New Bethlehem leans more Republican than 70 of 163 neighbors.
New Bethlehem runs about 59 points more Republican than Pennsylvania as a whole.
Politics vary noticeably by neighborhood within New Bethlehem. The west side is the most Republican-leaning (R+70) and the east side is the least Republican-leaning (R+50), a spread of about 20 points.
Why New Bethlehem leans the way it does
This analysis examined 14,881 data points per city to find what predicts political lean and turnout. The items below are a few correlations that stood out for New Bethlehem, not a ranked or complete list of what matters most.
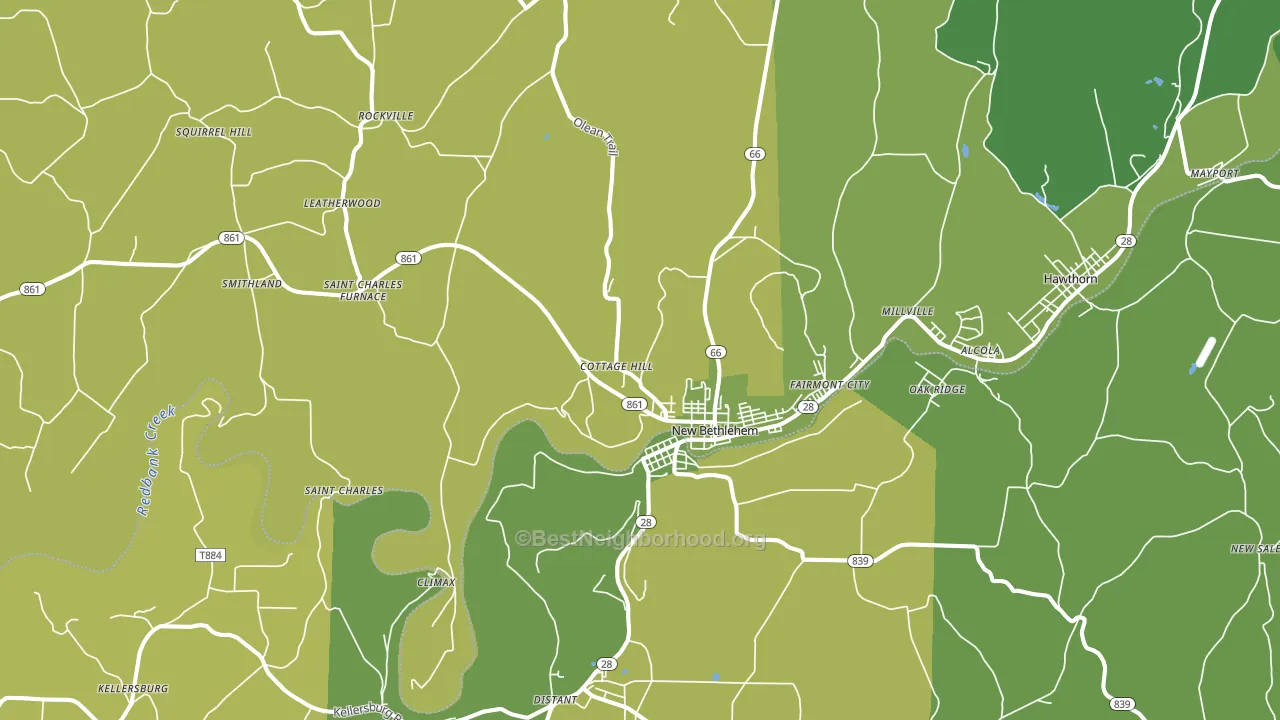
New Bethlehem votes Republican even though it is densely developed (about 34%, above 82% of cities). State and regional patterns outweigh the Democratic lean that density usually predicts here.
Paved land cover and Democratic lean
Places with extensive paved surfaces tend to lean Democratic; New Bethlehem, PA sits in the top quarter nationally on this measure. Paved ground does not change how people vote; it mostly reflects how urban and built-up a place is.
Why turnout in New Bethlehem looks the way it does
Turnout in New Bethlehem sits close to the national pattern. Routine healthcare access, homeownership, education, and food security all land near their national averages here. Learn more about the findings and methodology on the political spectrum map.
Nearby Cities
- South Bethlehem, PA R+68
- Distant, PA R+68
- Oak Ridge, PA R+70
- St. Charles, PA R+69
- Seminole, PA R+67
- Fairmount City, PA R+64
- Hawthorn, PA R+65
- Smithland, PA R+70
- Leatherwood, PA R+70
- Putneyville, PA R+69
Cities with Similar Populations
- Cato, NY R+41
- Taft, FL Even
- Country Club, MO R+35
- Crescent Springs, KY R+20
- Hindsville, AR R+60
- Vado, NM D+2
- Porum, OK R+64
- Elton, LA R+55
- North Fork, CA R+24
- Blue Mound, TX R+19
Sources and methodology
Precinct-level voting records used to fit the model come from Pennsylvania Department of State, Bureau of Elections, distributed by the Voting and Election Science Team. Demographic inputs come from the U.S. Census Bureau (ACS 5-year estimates and the 2020 Decennial Census). Health and environmental inputs come from the CDC (PLACES and the Environmental Justice Index). Land cover comes from the USGS and EPA. Election-day and lead-up weather come from PRISM 4km daily grids and the NOAA Global Historical Climatology Network. Mail-voting and election-administration patterns come from the MIT Election Lab's Survey of the Performance of American Elections. Block-group crime detail comes from CrimeGrade. Internet data and modeling support provided by ISPreports.org.
Modeling and analysis by the BestNeighborhood data science team. Full methodology and findings: political spectrum map.
Methodology reviewed by the BestNeighborhood data team. Last updated May 2026.