Ralls is a Republican stronghold. About 19% of voters here vote Democratic and 81% Republican.
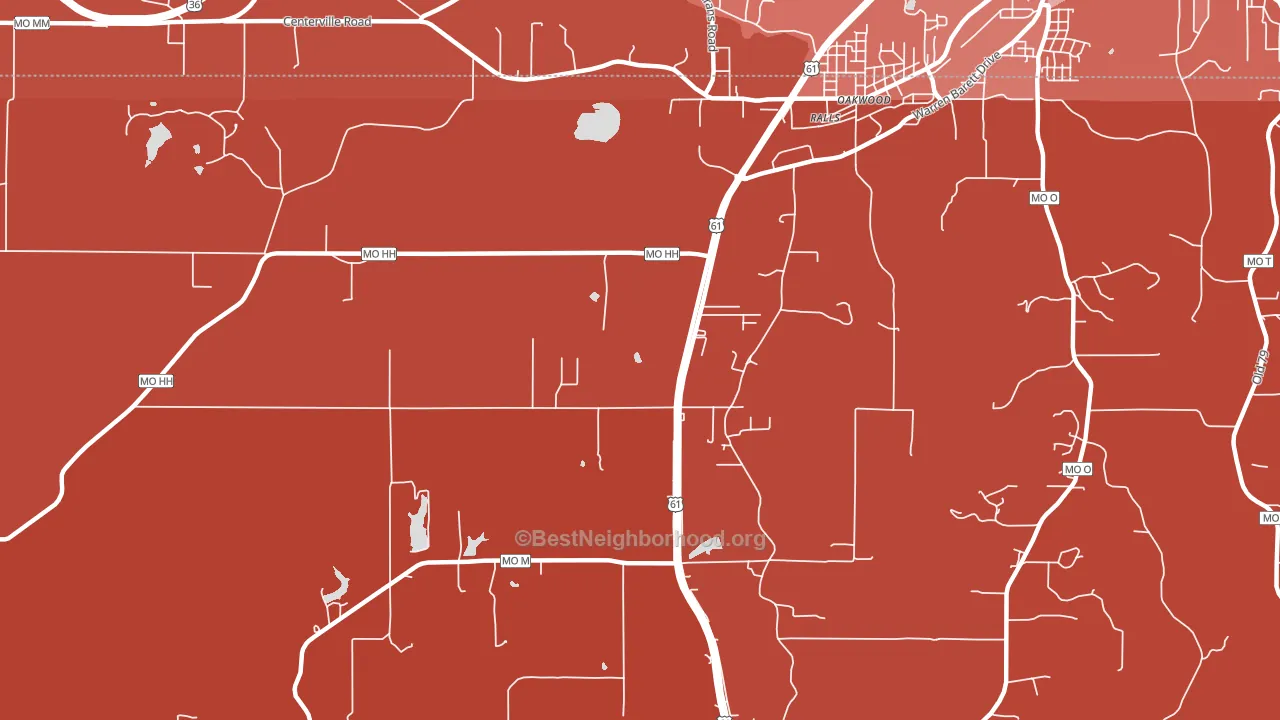
About 80% of adults in Ralls typically vote, above the U.S. average of about 62%. Among adults in Ralls, ~15% vote Democratic, ~65% Republican, and ~20% don't vote. The map below shows estimated turnout by block group.
How Ralls compares
Among cities within 25 miles, Ralls leans more Republican than 20 of 48 neighbors.
Ralls runs about 44 points more Republican than Missouri as a whole.
Why Ralls leans the way it does
This analysis examined 14,881 data points per city to find what predicts political lean and turnout. The items below are a few correlations that stood out for Ralls, not a ranked or complete list of what matters most.
Areas with many family households vote Republican. About 75% of households in Ralls are family households, about 9 points above the U.S. average of 67%.
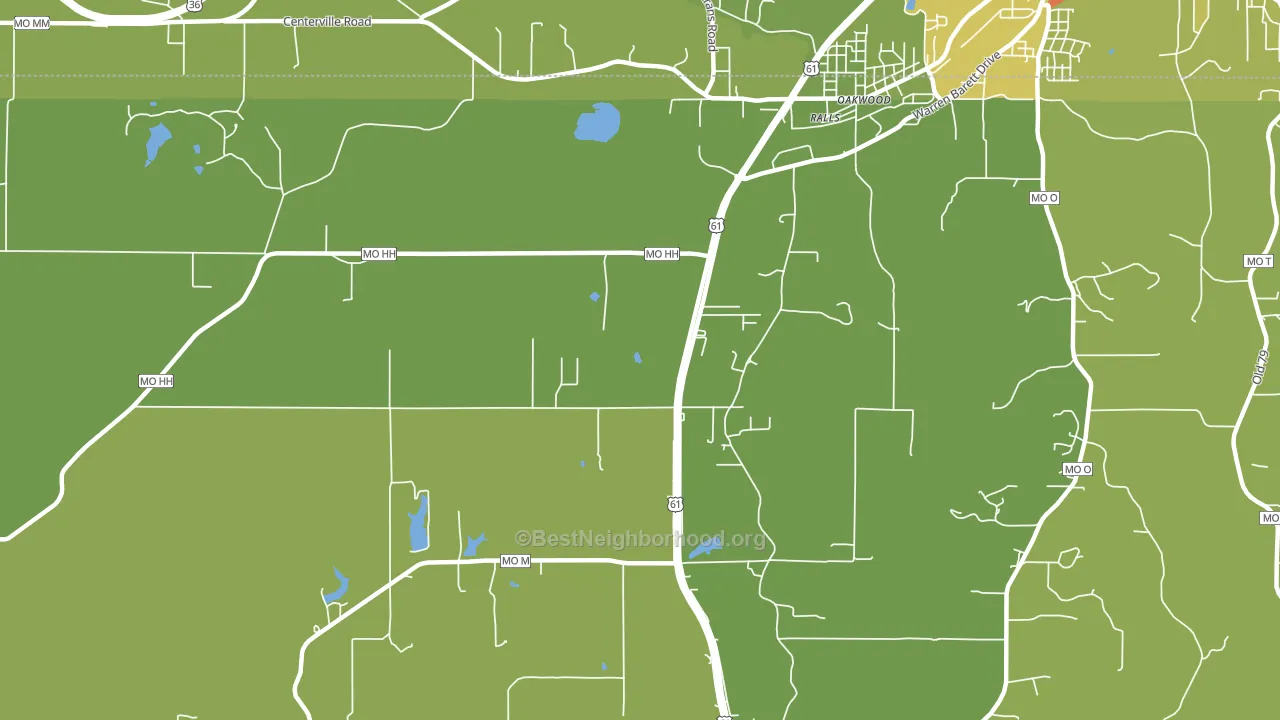
Foreign-born share and voter turnout
Places with a low foreign-born share tend to turn out in mixed patterns; Ralls, MO sits in the bottom tenth nationally on this measure.
Why turnout in Ralls looks the way it does
Turnout in Ralls sits close to the national pattern. Learn more about the findings and methodology on the political spectrum map.
Nearby Cities
- Oakwood, MO R+62
- Hannibal, MO R+37
- Withers Mill, MO R+62
- New London, MO R+59
- Spalding, MO R+66
- Ilasco, MO R+62
- Rensselaer, MO R+62
- West Ely, MO R+61
- Saverton, MO R+63
- Palmyra, MO R+53
Cities with Similar Populations
- Procious, WV R+62
- Woodland, MN D+13
- West Berkshire, VT R+41
- Ida, LA R+59
- Westchester, IN R+72
- Okaloosa, LA R+87
- Cross Anchor, SC R+66
- Little Meadows, PA R+53
- Black River, MI R+34
- Caney, LA R+90
Sources and methodology
Precinct-level voting records used to fit the model come from Missouri Secretary of State, Elections, distributed by the Voting and Election Science Team. Demographic inputs come from the U.S. Census Bureau (ACS 5-year estimates and the 2020 Decennial Census). Health and environmental inputs come from the CDC (PLACES and the Environmental Justice Index). Land cover comes from the USGS and EPA. Election-day and lead-up weather come from PRISM 4km daily grids and the NOAA Global Historical Climatology Network. Mail-voting and election-administration patterns come from the MIT Election Lab's Survey of the Performance of American Elections. Block-group crime detail comes from CrimeGrade. Internet data and modeling support provided by ISPreports.org.
Modeling and analysis by the BestNeighborhood data science team. Full methodology and findings: political spectrum map.
Methodology reviewed by the BestNeighborhood data team. Last updated May 2026.