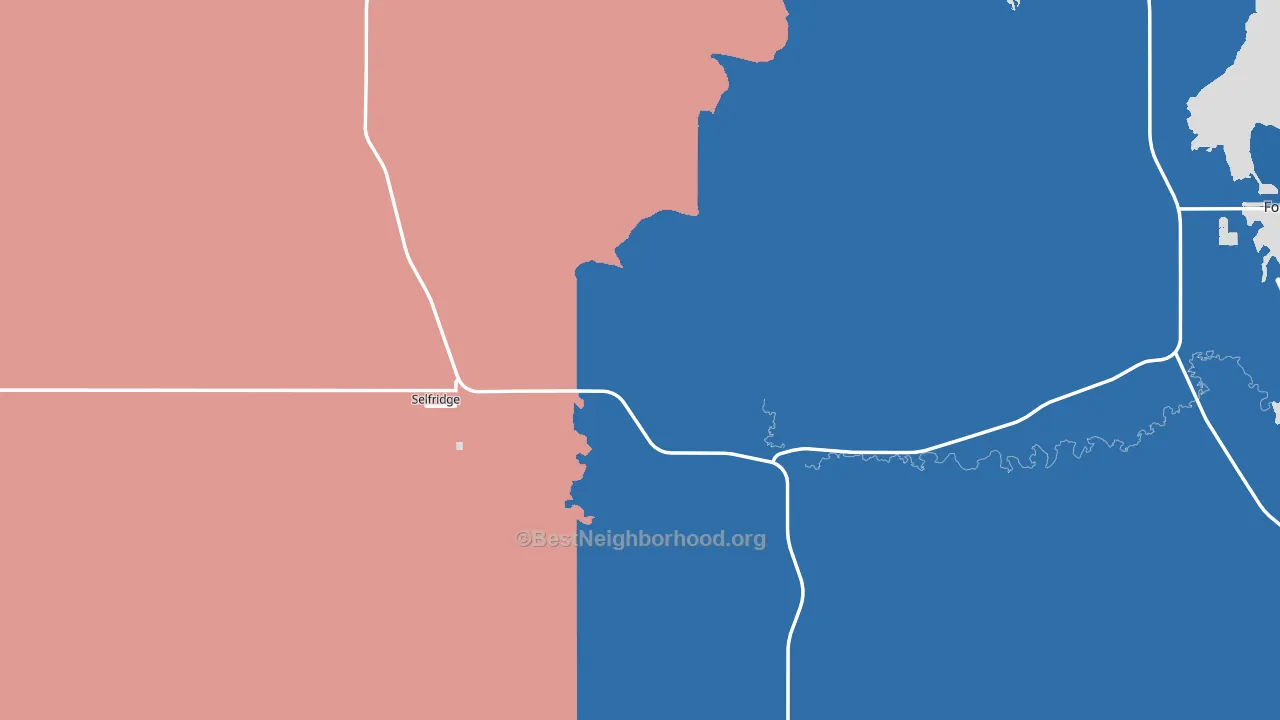
Selfridge leans heavily Democratic by roughly 32 points: about 66% of voters vote Democratic and 34% Republican.
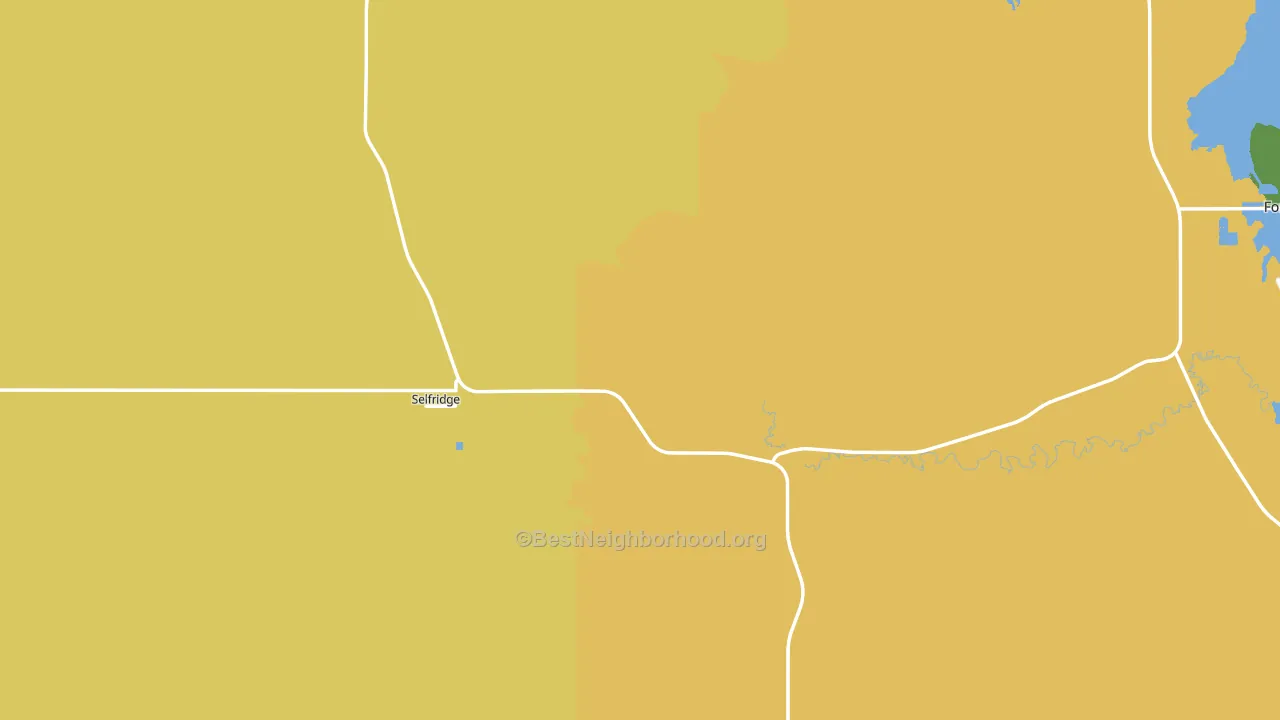
About 44% of adults in Selfridge typically vote, below the U.S. average of about 62%. Among adults in Selfridge, ~29% vote Democratic, ~15% Republican, and ~56% don't vote. The map below shows estimated turnout by block group.
How Selfridge compares
Among cities within 25 miles, Selfridge leans more Democratic than 3 of 8 neighbors.
Selfridge runs about 69 points more Democratic than North Dakota as a whole. North Dakota leans Republican overall, while Selfridge is one of the few Democratic-leaning pockets.
Politics vary noticeably by neighborhood within Selfridge. The east side runs the most Democratic (D+72) and the west side runs the most Republican (R+4), a spread of about 75 points.
Why Selfridge leans the way it does
This analysis examined 14,881 data points per city to find what predicts political lean and turnout. The items below are a few correlations that stood out for Selfridge, not a ranked or complete list of what matters most.
Selfridge votes against the grain of North Dakota. North Dakota leans Republican overall, while Selfridge runs about 69 points more Democratic. A high never-married share predicts Democratic voting, and about 46% of adults in Selfridge have never been married, above 97% of cities.
Food insecurity and voter turnout
Places with high food insecurity tend to turn out at a lower rate; Selfridge, ND sits in the top tenth nationally on this measure. Food insecurity does not directly drive turnout; it reflects economic hardship, which lines up with lower voting.
Why turnout in Selfridge looks the way it does
Areas with limited routine healthcare access turn out at lower rates. Selfridge is in the bottom quarter nationally for routine-care measures such as insurance coverage, preventive screenings, and dental visits. The dental-visit rate here is about 41%, about 23 points below the North Dakota average of 64%. Renters vote less often than owners, and about 42% of households in Selfridge rent, about 17 points above the U.S. average of 25%. High food insecurity lines up with lower turnout, and about 42% of adults in Selfridge report food insecurity, in the top fraction of cities. Learn more about the findings and methodology on the political spectrum map.
Nearby Cities
- Maple Leaf, SD D+52
- Fort Yates, ND D+67
- McLaughlin, SD D+50
- Liberty, SD D+48
- Shields, ND R+41
- Bullhead, SD D+58
- Timmer, ND R+62
- McIntosh, SD R+44
- Cannon Ball, ND D+40
Cities with Similar Populations
- Wet Glaize, MO R+72
- New Wren, MS R+5
- Davin, WV R+69
- Beacon Heights, GA R+34
- Whitaker, IL R+53
- Washington, NE R+48
- Hillham, IN R+60
- New Harbor, ME D+22
- Ivywild, CO R+17
- Fairview, KS R+54
Sources and methodology
Precinct-level voting records used to fit the model come from North Dakota Secretary of State, Elections, distributed by the Voting and Election Science Team. Demographic inputs come from the U.S. Census Bureau (ACS 5-year estimates and the 2020 Decennial Census). Health and environmental inputs come from the CDC (PLACES and the Environmental Justice Index). Land cover comes from the USGS and EPA. Election-day and lead-up weather come from PRISM 4km daily grids and the NOAA Global Historical Climatology Network. Mail-voting and election-administration patterns come from the MIT Election Lab's Survey of the Performance of American Elections. Block-group crime detail comes from CrimeGrade. Internet data and modeling support provided by ISPreports.org.
Modeling and analysis by the BestNeighborhood data science team. Full methodology and findings: political spectrum map.
Methodology reviewed by the BestNeighborhood data team. Last updated May 2026.