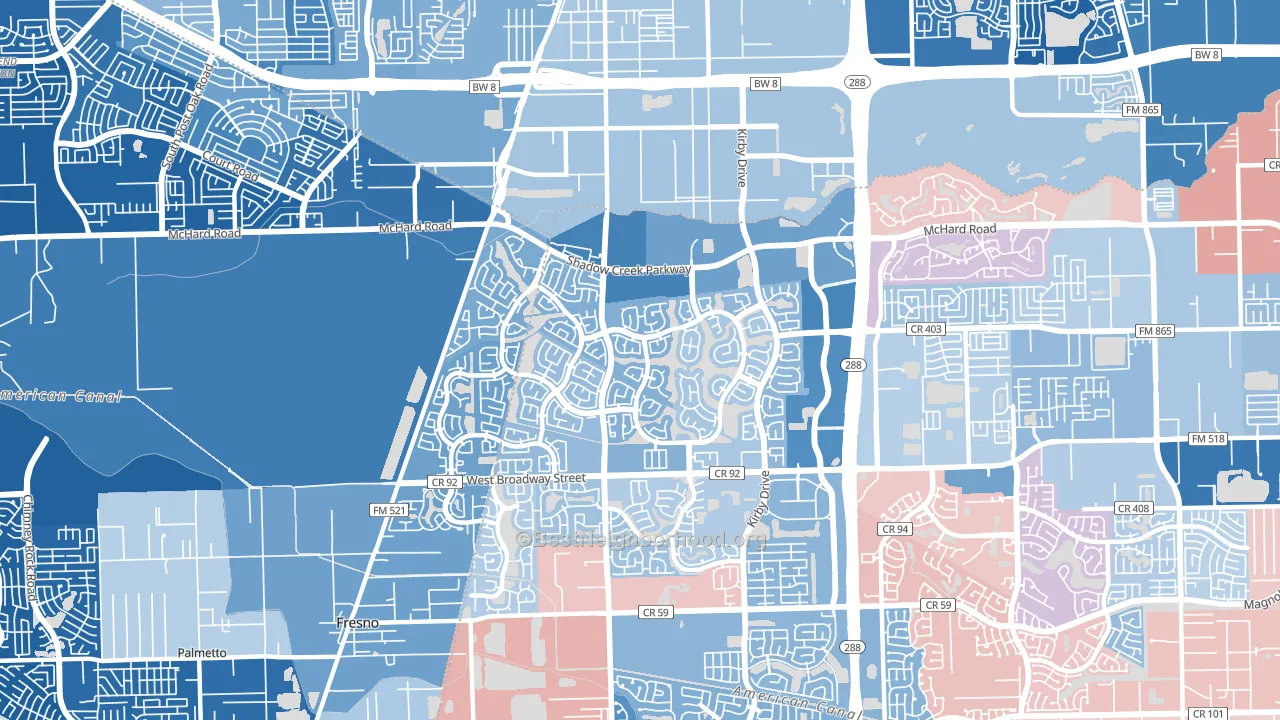
Shadow Creek Ranch leans heavily Democratic by roughly 34 points: about 67% of voters vote Democratic and 33% Republican.
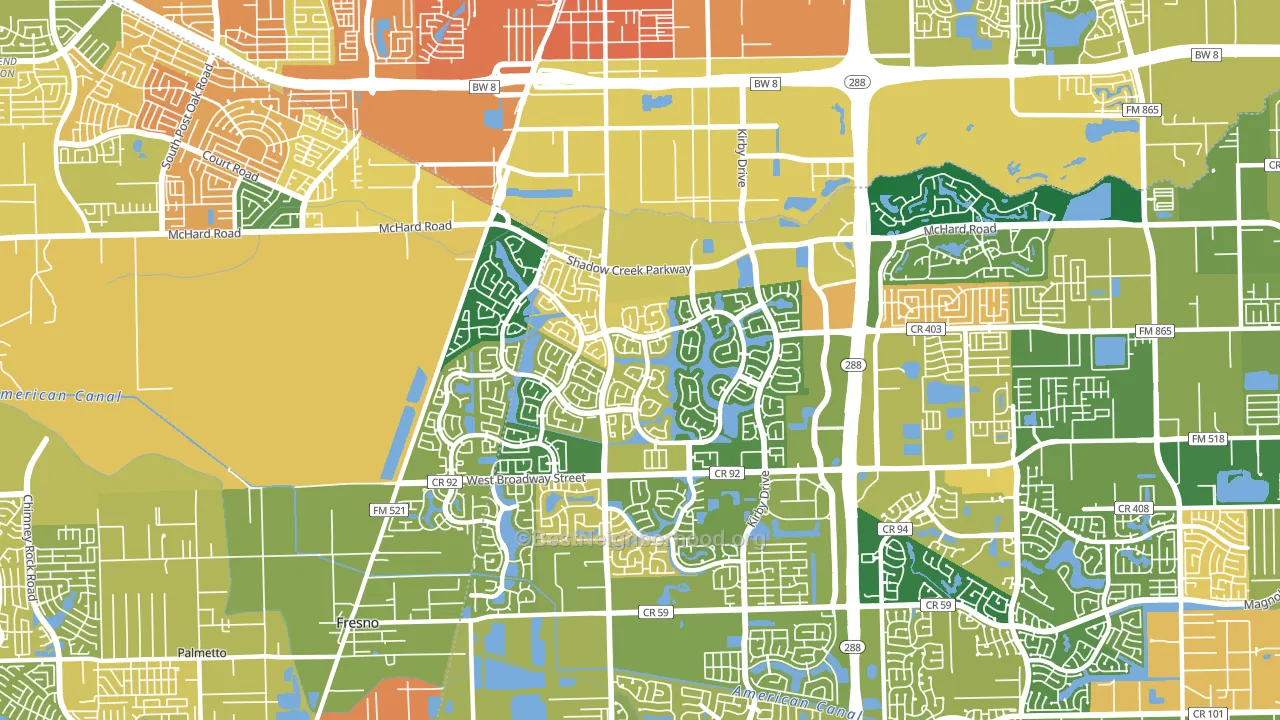
About 67% of adults in Shadow Creek Ranch typically vote, near the U.S. average of about 62%. Among adults in Shadow Creek Ranch, ~45% vote Democratic, ~22% Republican, and ~33% don't vote. The map below shows estimated turnout by block group.
How Shadow Creek Ranch compares
Among neighborhoods within 5 miles, Shadow Creek Ranch is the least Democratic-leaning.
Shadow Creek Ranch runs about 47 points more Democratic than Texas as a whole. Texas leans Republican overall, while Shadow Creek Ranch is one of the few Democratic-leaning pockets.
Politics vary noticeably by block within Shadow Creek Ranch. The north side is the most Democratic-leaning (D+44) and the southeast side is the least Democratic-leaning (D+18), a spread of about 26 points.
Why Shadow Creek Ranch leans the way it does
This analysis examined 14,881 data points per neighborhood to find what predicts political lean and turnout. The items below are a few correlations that stood out for Shadow Creek Ranch, not a ranked or complete list of what matters most.
Shadow Creek Ranch votes against the grain of Texas. Texas leans Republican overall, while Shadow Creek Ranch runs about 47 points more Democratic. High college attainment predicts Democratic voting, and Shadow Creek Ranch sits in the top quarter (about 63%, above 84% of neighborhoods).
Paved land cover and Democratic lean
Places with extensive paved surfaces tend to lean Democratic; Shadow Creek Ranch, Pearland, TX sits in the top quarter nationally on this measure. Paved ground does not change how people vote; it mostly reflects how urban and built-up a place is.
Why turnout in Shadow Creek Ranch looks the way it does
Areas with high high-school completion turn out at higher rates. About 98% of adults in Shadow Creek Ranch have completed high school, about 13 points above the Texas average of 86%. Learn more about the findings and methodology on the political spectrum map.
Nearby Neighborhoods
- Magnolia Place, Fresno, TX D+44
- Central Southwest, Houston, TX D+51
- Fort Bend Houston, Missouri City, TX D+68
- Fondren Gardens, Houston, TX D+44
- Westbury, Houston, TX D+43
- South Main, Houston, TX D+60
- Willow Meadows-Willowbend Area, Houston, TX D+36
- Meyerland, Houston, TX D+29
- Southeast, Houston, TX D+49
- Medical, Houston, TX D+41
Neighborhoods with Similar Populations
- Northwest Austin, Austin, TX D+25
- Springfield Gardens, Queens, NY D+78
- UC Irvine, Irvine, CA D+70
- Metro West, Orlando, FL D+20
- Highland, St. Paul, MN D+60
- Point Breeze-Philadelphia, Philadelphia, PA D+73
- Clifton, Staten Island, NY D+33
- Cooper Mountain-Aloha North, Aloha, OR D+29
- Ramona, Riverside, CA D+7
- Logan-Ogontz-Fern Rock, Philadelphia, PA D+85
Sources and methodology
Precinct-level voting records used to fit the model come from Texas Secretary of State, Elections Division, distributed by the Voting and Election Science Team. Demographic inputs come from the U.S. Census Bureau (ACS 5-year estimates and the 2020 Decennial Census). Health and environmental inputs come from the CDC (PLACES and the Environmental Justice Index). Land cover comes from the USGS and EPA. Election-day and lead-up weather come from PRISM 4km daily grids and the NOAA Global Historical Climatology Network. Mail-voting and election-administration patterns come from the MIT Election Lab's Survey of the Performance of American Elections. Block-group crime detail comes from CrimeGrade. Internet data and modeling support provided by ISPreports.org.
Modeling and analysis by the BestNeighborhood data science team. Full methodology and findings: political spectrum map.
Methodology reviewed by the BestNeighborhood data team. Last updated May 2026.