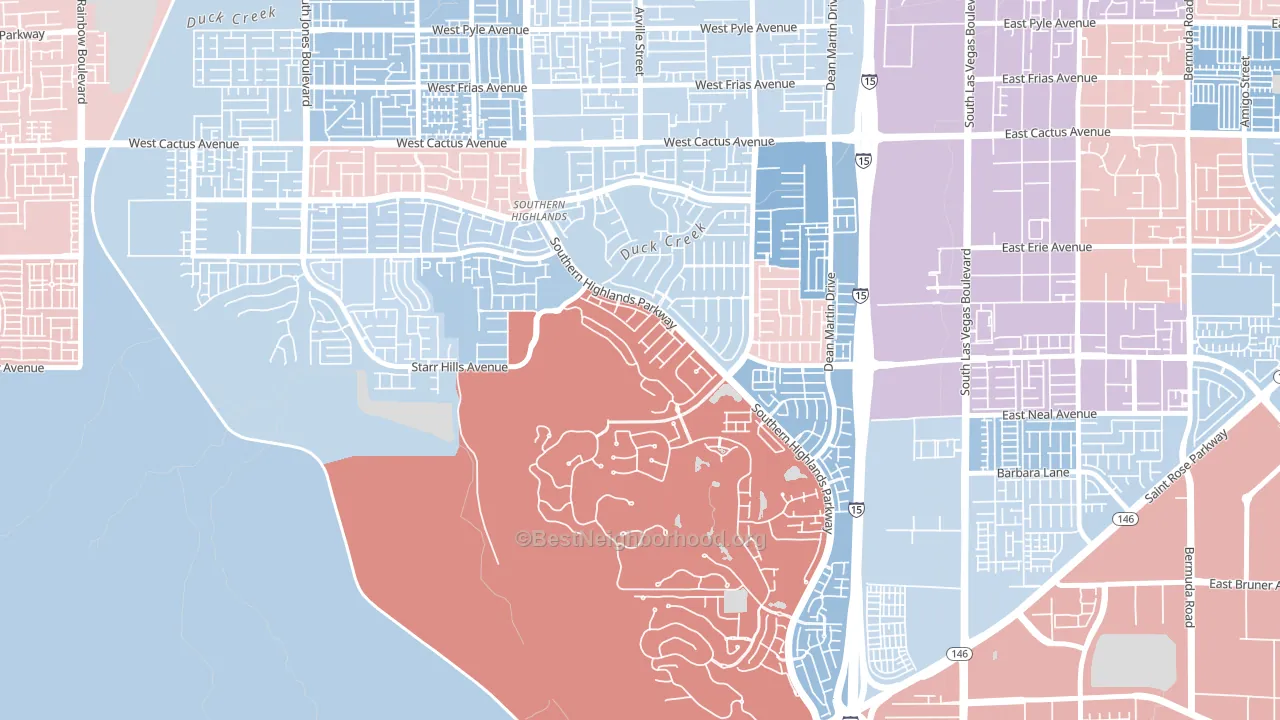
Southern Highlands leans slightly Republican by roughly 6 points: about 47% of voters vote Democratic and 53% Republican.
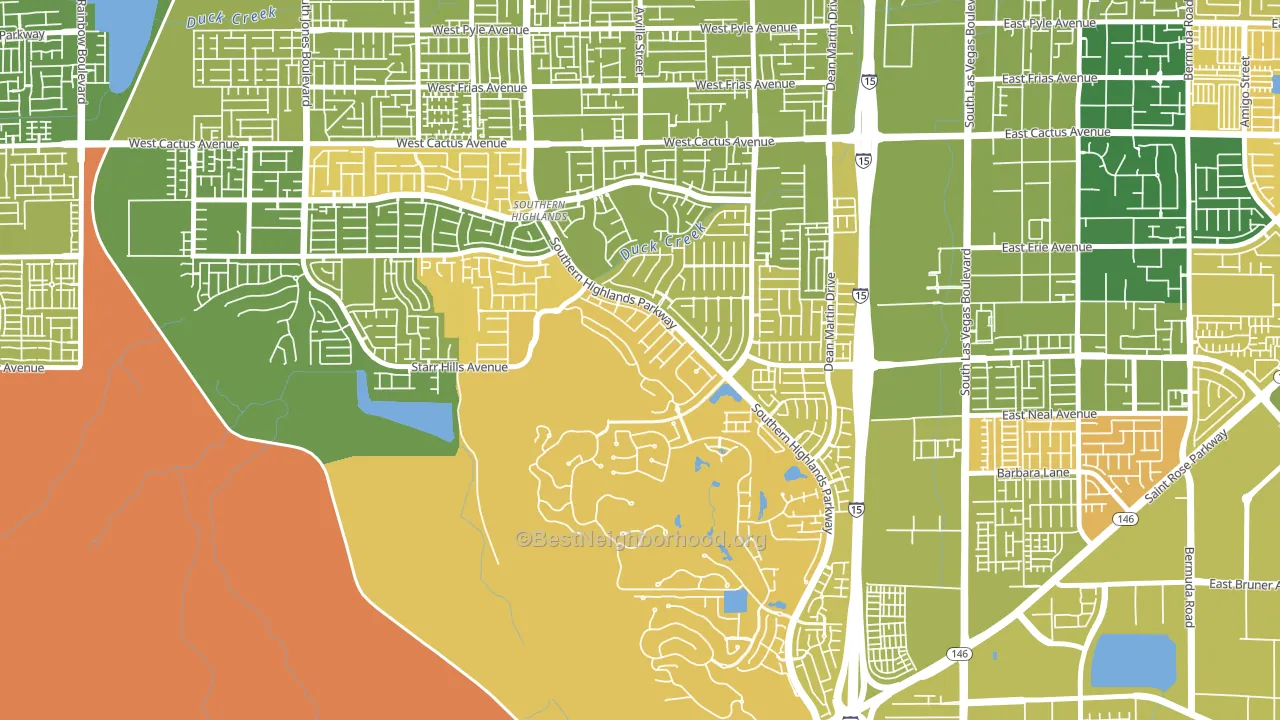
About 62% of adults in Southern Highlands typically vote, near the U.S. average of about 62%. Among adults in Southern Highlands, ~29% vote Democratic, ~33% Republican, and ~38% don't vote. The map below shows estimated turnout by block group.
How Southern Highlands compares
Among neighborhoods within 5 miles, Southern Highlands is the most Republican-leaning.
Politically, Southern Highlands sits close to the rest of Nevada.
Politics vary noticeably by block within Southern Highlands. The northeast side runs the most Democratic (D+13) and the south side runs the most Republican (R+22), a spread of about 35 points.
Why Southern Highlands leans the way it does
This analysis examined 14,881 data points per neighborhood to find what predicts political lean and turnout. The items below are a few correlations that stood out for Southern Highlands, not a ranked or complete list of what matters most.
Rural areas vote Republican, and Southern Highlands sits in the bottom quarter on developed land relative to similar places.
High-school completion, developed land, and voter turnout
Places that combine high-school-completion-heavy adults and a rural land-use pattern tend to turn out at a higher rate, as Southern Highlands, Enterprise, NV does.
Why turnout in Southern Highlands looks the way it does
Turnout in Southern Highlands sits close to the national pattern. Routine healthcare access, homeownership, education, and food security all land near their national averages here. Learn more about the findings and methodology on the political spectrum map.
Nearby Neighborhoods
- Mountain's Edge, Las Vegas, NV Even
- Westgate, Henderson, NV D+6
- West Henderson, Henderson, NV Even
- Anthem, Henderson, NV Even
- Macdonald Ranch, Henderson, NV Even
- Green Valley South, Henderson, NV D+8
- Green Valley Ranch, Henderson, NV D+4
- Sovana, Spring Valley, NV D+15
- Paradise, Las Vegas, NV D+17
- Rhodes Ranch, Spring Valley, NV D+12
Neighborhoods with Similar Populations
- Bridle Trails, Bellevue, WA D+46
- North Hyde Park, Tampa, FL D+12
- Columbus Park, Worcester, MA D+29
- Windsor Park, Chicago, IL D+81
- Winter Hill, Somerville, MA D+65
- North Boulder, Boulder, CO D+72
- Shaw, Washington, DC D+84
- North Berkeley, Berkeley, CA D+82
- Maplewood, Fall River, MA R+6
- Rock Creek, Clackamas, OR D+10
Sources and methodology
Precinct-level voting records used to fit the model come from Nevada Secretary of State, Elections, distributed by the Voting and Election Science Team. Demographic inputs come from the U.S. Census Bureau (ACS 5-year estimates and the 2020 Decennial Census). Health and environmental inputs come from the CDC (PLACES and the Environmental Justice Index). Land cover comes from the USGS and EPA. Election-day and lead-up weather come from PRISM 4km daily grids and the NOAA Global Historical Climatology Network. Mail-voting and election-administration patterns come from the MIT Election Lab's Survey of the Performance of American Elections. Block-group crime detail comes from CrimeGrade. Internet data and modeling support provided by ISPreports.org.
Modeling and analysis by the BestNeighborhood data science team. Full methodology and findings: political spectrum map.
Methodology reviewed by the BestNeighborhood data team. Last updated May 2026.