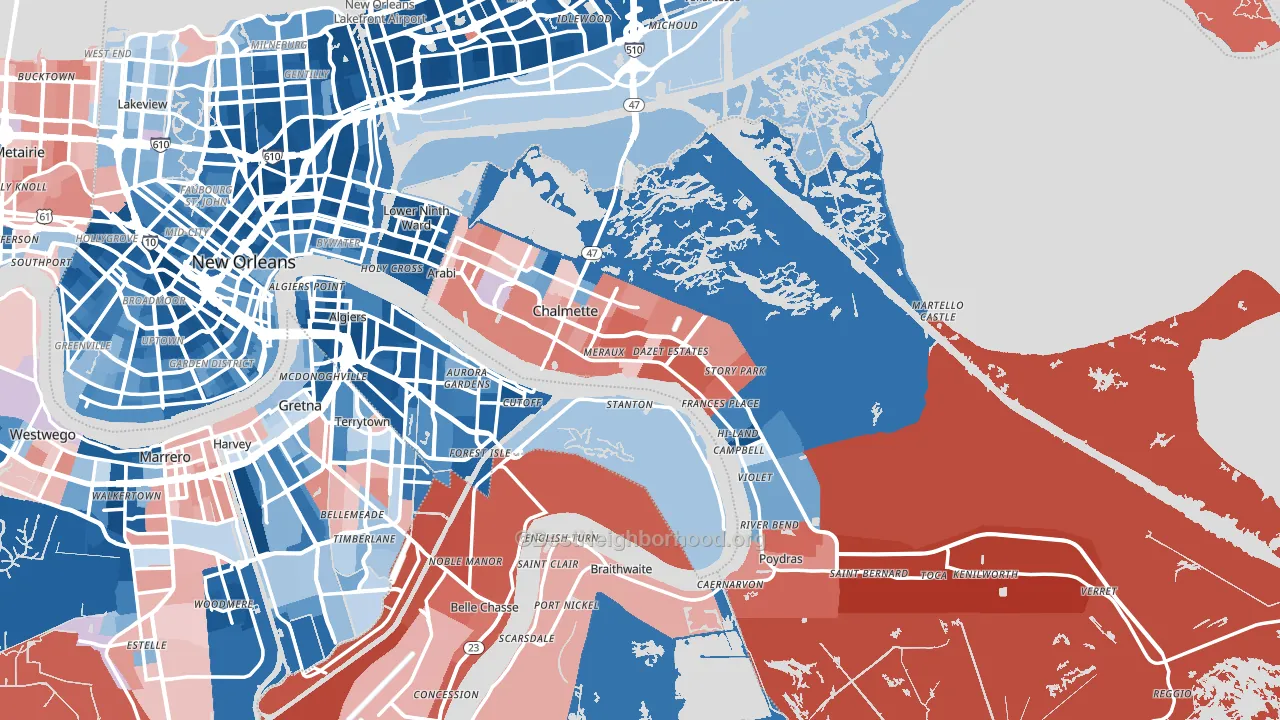
St. Bernard Parish leans slightly Republican by roughly 14 points: about 43% of voters vote Democratic and 57% Republican.
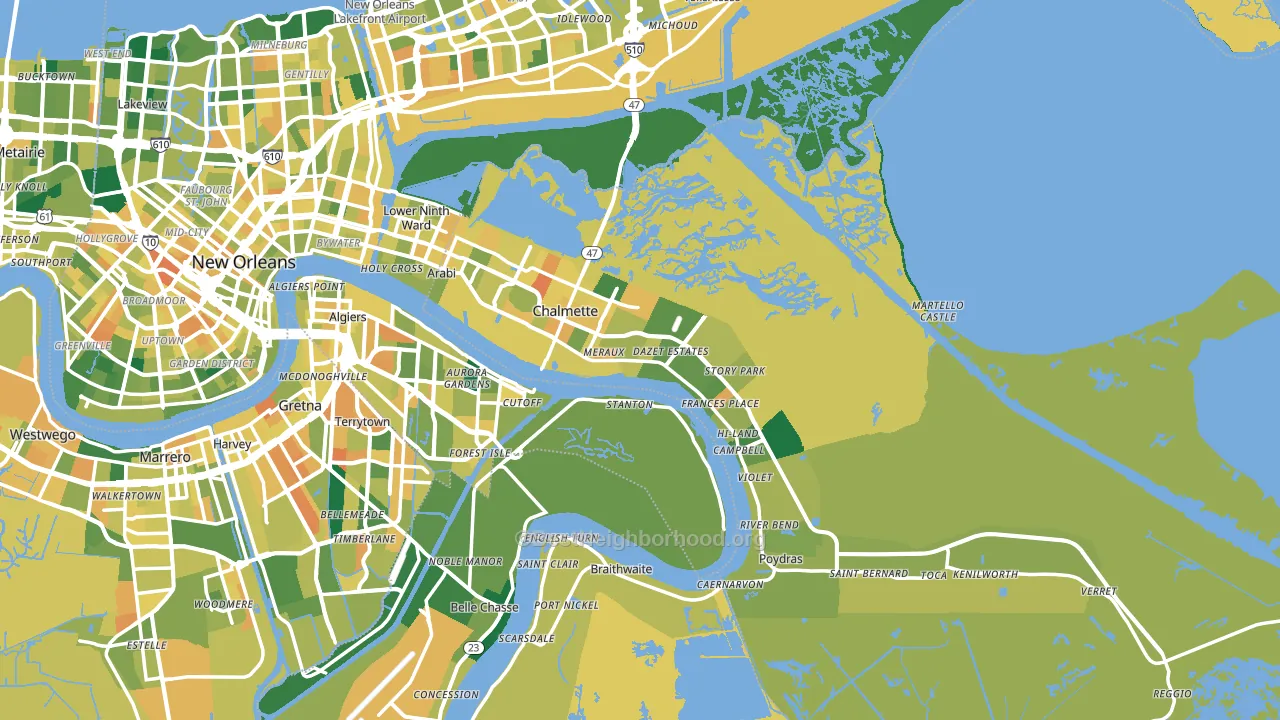
About 61% of adults in St. Bernard Parish typically vote, near the U.S. average of about 62%. Among adults in St. Bernard Parish, ~26% vote Democratic, ~35% Republican, and ~39% don't vote. The map below shows estimated turnout by block group.
How St. Bernard Parish compares
Among counties within 50 miles, St. Bernard Parish leans more Republican than 4 of 9 neighbors.
St. Bernard Parish runs about 8 points more Democratic than Louisiana as a whole.
Politics vary noticeably by city within St. Bernard Parish. The northwest side runs the most Democratic (Even) and the southeast side runs the most Republican (R+63), a spread of about 65 points.
Why St. Bernard Parish leans the way it does
This analysis examined 14,881 data points per county to find what predicts political lean and turnout. The items below are a few correlations that stood out for St. Bernard Parish, not a ranked or complete list of what matters most.
St. Bernard Parish votes Republican even though it is densely developed (about 74%, far above the Louisiana average of 25%). State and regional patterns outweigh the Democratic lean that density usually predicts here. Low college attainment predicts Republican voting, and St. Bernard Parish sits in the bottom quarter (about 17%, below 76% of counties).
Preventive-care access and voter turnout
Places with limited routine preventive-care access tend to turn out at a lower rate; St. Bernard Parish, LA sits in the bottom quarter nationally on this measure. Dental visits do not drive turnout; the rate reflects income, insurance, and healthcare access, which line up with who votes.
Why turnout in St. Bernard Parish looks the way it does
Areas with high food insecurity turn out at lower rates. About 28% of adults in St. Bernard Parish report food insecurity, about 12 points above the U.S. average of 16%. Low high-school completion lines up with lower turnout, and about 82% of adults in St. Bernard Parish have completed high school, below 91% of counties. Learn more about the findings and methodology on the political spectrum map.
Nearby Counties
- Orleans Parish, LA D+63
- Jefferson Parish, LA D+4
- Plaquemines Parish, LA R+27
- St. Charles Parish, LA R+25
- St. Tammany Parish, LA R+35
- St. John the Baptist Parish, LA D+27
- Hancock County, MS R+53
- Lafourche Parish, LA R+55
- St. James Parish, LA D+3
- Pearl River County, MS R+60
Counties with Similar Populations
- Pittsburg County, OK R+54
- Kandiyohi County, MN R+29
- Baldwin County, GA Even
- Madison County, OH R+39
- Gadsden County, FL D+28
- Kay County, OK R+46
- Brown County, OH R+61
- Dubois County, IN R+44
- Suwannee County, FL R+58
- Siskiyou County, CA R+17
Sources and methodology
Precinct-level voting records used to fit the model come from Louisiana Secretary of State, Elections, distributed by the Voting and Election Science Team. Demographic inputs come from the U.S. Census Bureau (ACS 5-year estimates and the 2020 Decennial Census). Health and environmental inputs come from the CDC (PLACES and the Environmental Justice Index). Land cover comes from the USGS and EPA. Election-day and lead-up weather come from PRISM 4km daily grids and the NOAA Global Historical Climatology Network. Mail-voting and election-administration patterns come from the MIT Election Lab's Survey of the Performance of American Elections. Block-group crime detail comes from CrimeGrade. Internet data and modeling support provided by ISPreports.org.
Modeling and analysis by the BestNeighborhood data science team. Full methodology and findings: political spectrum map.
Methodology reviewed by the BestNeighborhood data team. Last updated May 2026.