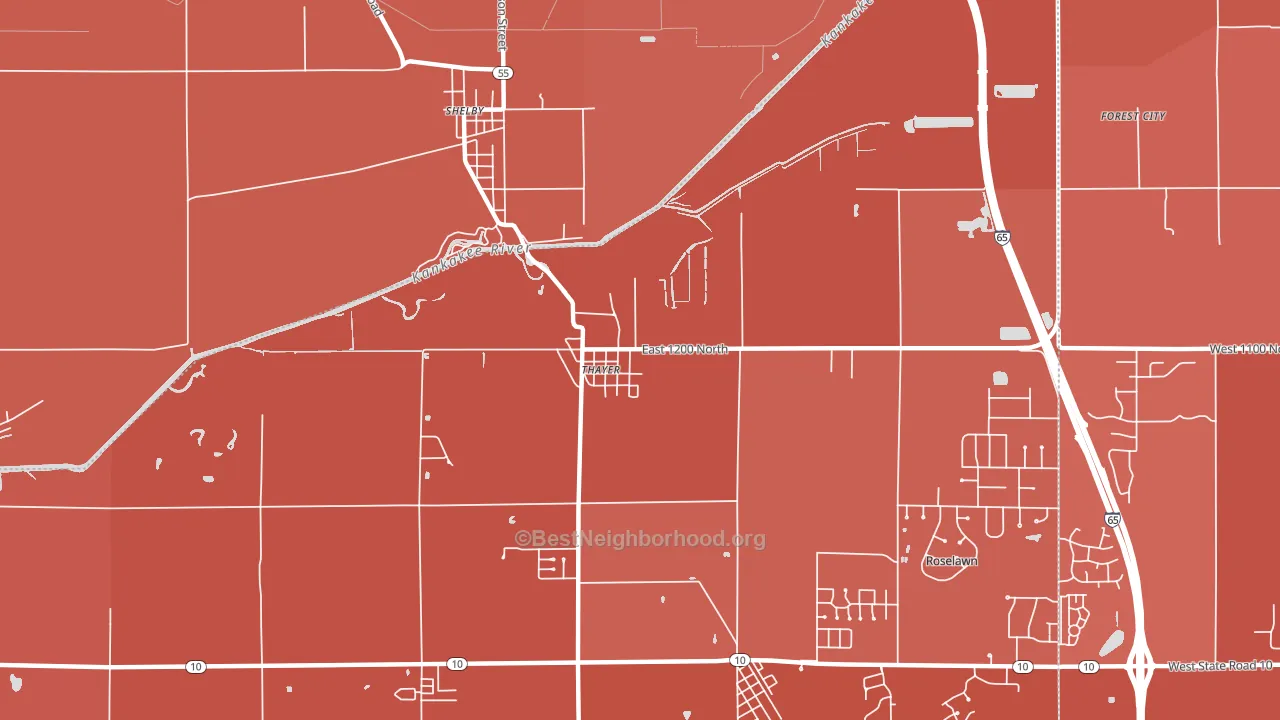
Thayer is a Republican stronghold. About 21% of voters here vote Democratic and 79% Republican.
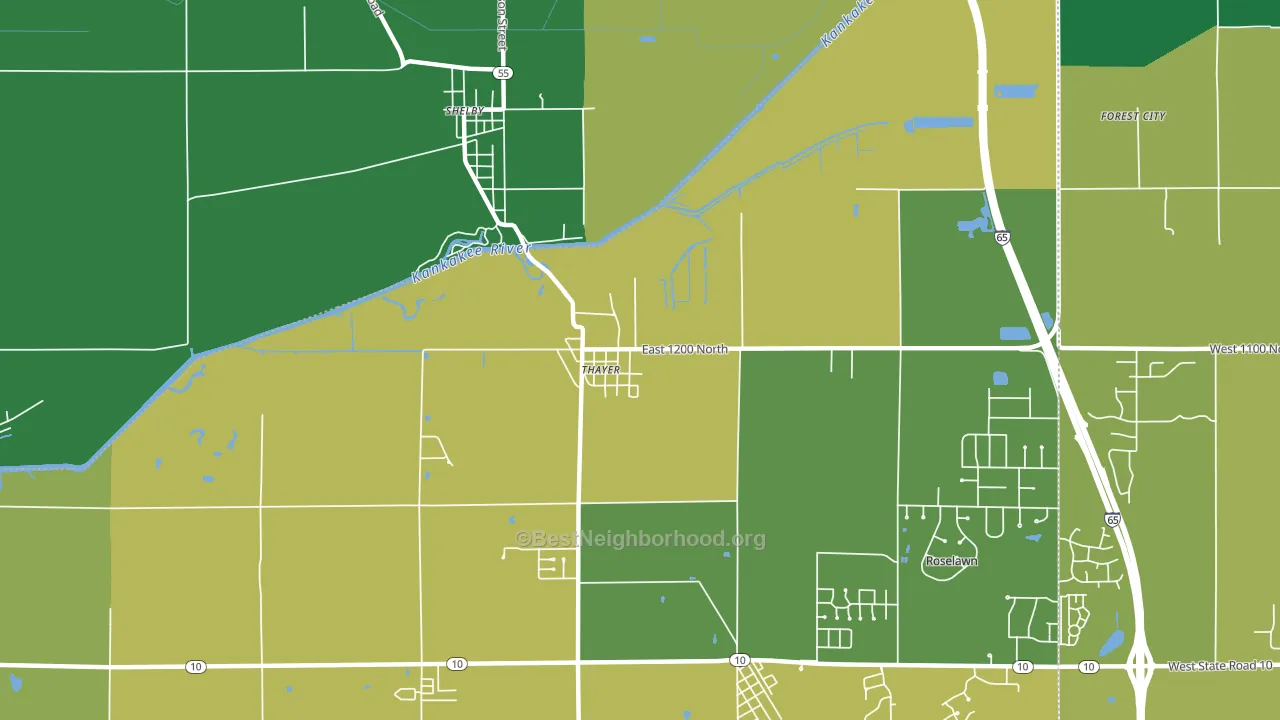
About 67% of adults in Thayer typically vote, near the U.S. average of about 62%. Among adults in Thayer, ~14% vote Democratic, ~53% Republican, and ~33% don't vote. The map below shows estimated turnout by block group.
How Thayer compares
Among cities within 25 miles, Thayer leans more Republican than 53 of 66 neighbors.
Thayer runs about 38 points more Republican than Indiana as a whole.
Politics vary noticeably by neighborhood within Thayer. The southwest side is the most Republican-leaning (R+58) and the east side is the least Republican-leaning (R+46), a spread of about 12 points.
Why Thayer leans the way it does
This analysis examined 14,881 data points per city to find what predicts political lean and turnout. The items below are a few correlations that stood out for Thayer, not a ranked or complete list of what matters most.
Areas with many family households vote Republican. About 81% of households in Thayer are family households, about 14 points above the U.S. average of 67%.
Walkability and Republican lean
Places with a low walkability score tend to lean Republican; Thayer, IN sits below the national average on this measure. A walkable street grid does not change how people vote; it mostly reflects how urban a place is.
Why turnout in Thayer looks the way it does
Areas with high high-school completion turn out at higher rates. About 98% of adults in Thayer have completed high school, about 8 points above the Indiana average of 90%. Learn more about the findings and methodology on the political spectrum map.
Nearby Cities
- Roselawn, IN R+48
- Shelby, IN R+52
- Sumava Resorts, IN R+55
- DeMotte, IN R+47
- Lake Village, IN R+58
- Schneider, IN R+58
- Fair Oaks, IN R+59
- Southeast Grove, IN R+49
- Kersey, IN R+48
- Lowell, IN R+39
Cities with Similar Populations
- Lorenz Park, NY Even
- South Calera, AL R+54
- Rimby, MO R+70
- Clear, AK R+37
- Furman, AL D+34
- Flaxville, MT R+68
- Rex, AR R+69
- Fishers Landing, AZ R+46
- Terra, UT R+63
- Fowler Grove, TN R+72
Sources and methodology
Precinct-level voting records used to fit the model come from Indiana Secretary of State, Elections, distributed by the Voting and Election Science Team. Demographic inputs come from the U.S. Census Bureau (ACS 5-year estimates and the 2020 Decennial Census). Health and environmental inputs come from the CDC (PLACES and the Environmental Justice Index). Land cover comes from the USGS and EPA. Election-day and lead-up weather come from PRISM 4km daily grids and the NOAA Global Historical Climatology Network. Mail-voting and election-administration patterns come from the MIT Election Lab's Survey of the Performance of American Elections. Block-group crime detail comes from CrimeGrade. Internet data and modeling support provided by ISPreports.org.
Modeling and analysis by the BestNeighborhood data science team. Full methodology and findings: political spectrum map.
Methodology reviewed by the BestNeighborhood data team. Last updated May 2026.