Wainville is a Republican stronghold. About 14% of voters here vote Democratic and 86% Republican.
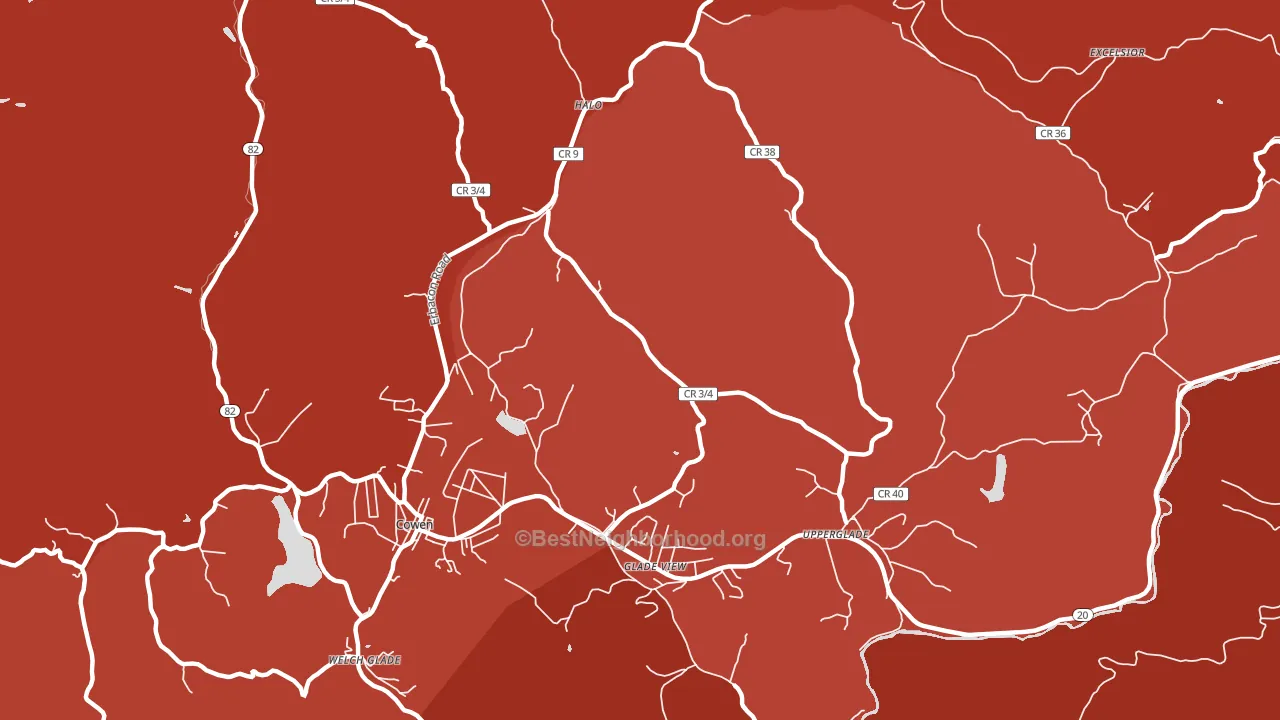
About 61% of adults in Wainville typically vote, near the U.S. average of about 62%. Among adults in Wainville, ~9% vote Democratic, ~52% Republican, and ~39% don't vote. The map below shows estimated turnout by block group.
How Wainville compares
Among cities within 25 miles, Wainville leans more Republican than 79 of 80 neighbors.
Wainville runs about 31 points more Republican than West Virginia as a whole.
Why Wainville leans the way it does
This analysis examined 14,881 data points per city to find what predicts political lean and turnout. The items below are a few correlations that stood out for Wainville, not a ranked or complete list of what matters most.
Areas with low college attainment vote Republican. About 6% of adults in Wainville hold a bachelor's degree, about 11 points below the West Virginia average of 17%. A high family-household share predicts Republican voting, and about 81% of households in Wainville are family households, above 92% of cities.
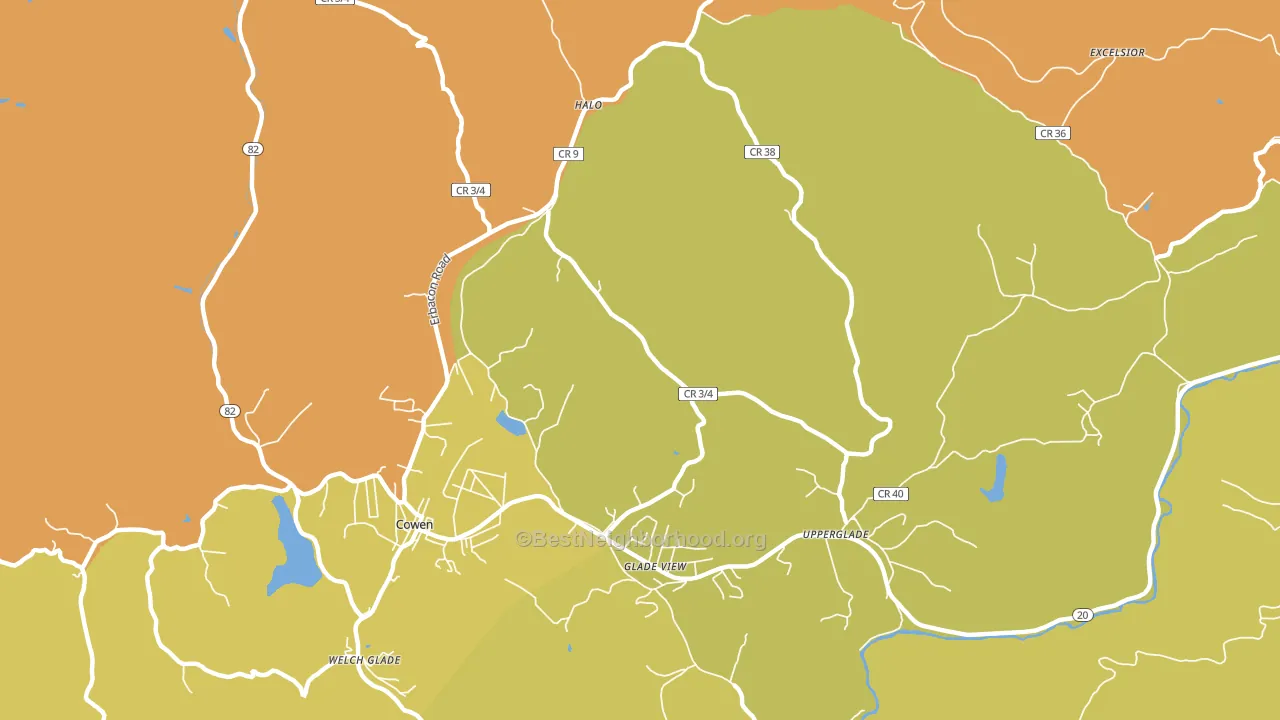
Homeownership and voter turnout
Places with renter-heavy households tend to turn out at a lower rate; Wainville, WV sits in the bottom tenth nationally on this measure.
Why turnout in Wainville looks the way it does
Renters vote less often than owners. About 35% of households in Wainville rent, about 10 points above the U.S. average of 25%. Low high-school completion lines up with lower turnout, and about 86% of adults in Wainville have completed high school, below 76% of cities. High-crime urban areas turn out at lower rates, and Wainville sits in the top 15% on a violent-crime measure. Learn more about the findings and methodology on the political spectrum map.
Nearby Cities
- Cowen, WV R+69
- Boggs, WV R+72
- Upperglade, WV R+72
- Donaldson, WV R+72
- Welch Glade, WV R+64
- Gauley Mills, WV R+67
- Camden-on-Gauley, WV R+65
- Bolair, WV R+73
- Strouds, WV R+63
- Cherry Falls, WV R+66
Cities with Similar Populations
- Rushtown, PA R+45
- Willard, WV R+63
- Paul Spur, AZ R+24
- La Rose, IL R+46
- Parlett, OH R+54
- Hickory Hill, FL R+81
- Longdale Furnace, VA R+58
- Vernon, CO R+75
- Campus, IL R+50
- Lenox, TN R+76
Sources and methodology
Precinct-level voting records used to fit the model come from West Virginia Secretary of State, Elections, distributed by the Voting and Election Science Team. Demographic inputs come from the U.S. Census Bureau (ACS 5-year estimates and the 2020 Decennial Census). Health and environmental inputs come from the CDC (PLACES and the Environmental Justice Index). Land cover comes from the USGS and EPA. Election-day and lead-up weather come from PRISM 4km daily grids and the NOAA Global Historical Climatology Network. Mail-voting and election-administration patterns come from the MIT Election Lab's Survey of the Performance of American Elections. Block-group crime detail comes from CrimeGrade. Internet data and modeling support provided by ISPreports.org.
Modeling and analysis by the BestNeighborhood data science team. Full methodology and findings: political spectrum map.
Methodology reviewed by the BestNeighborhood data team. Last updated May 2026.