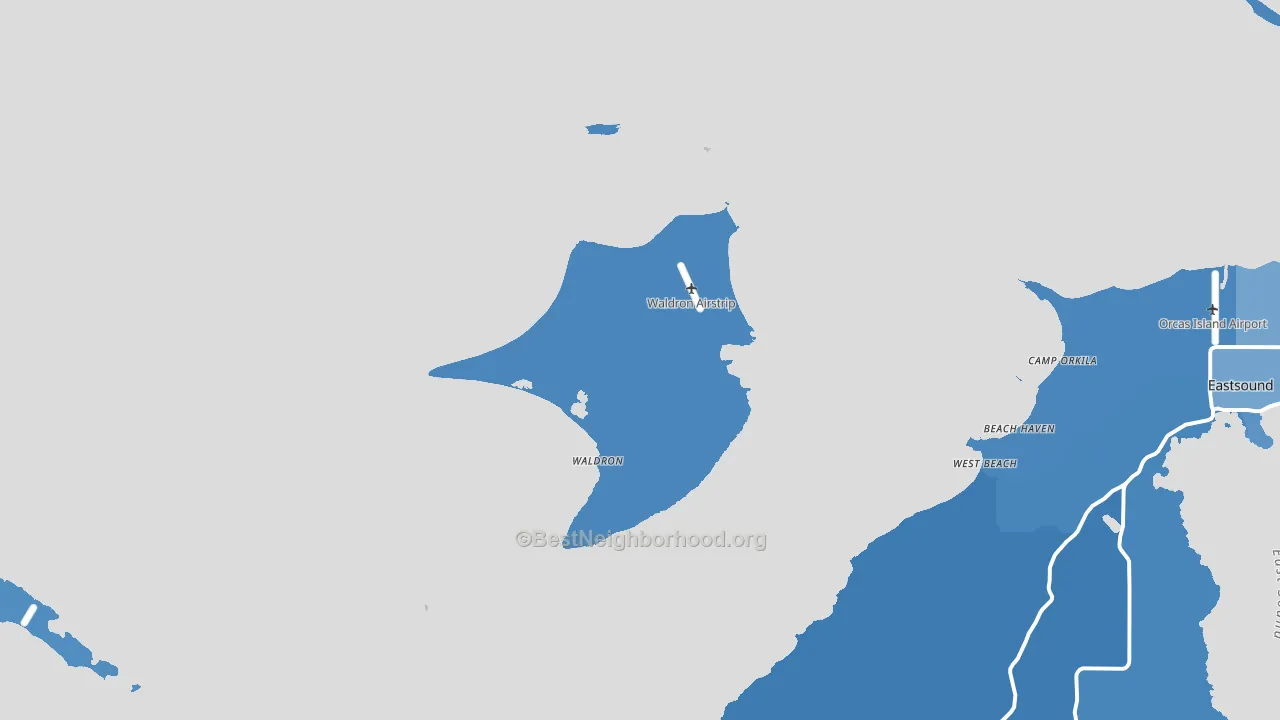
Waldron is a Democratic stronghold. About 83% of voters here vote Democratic and 17% Republican.
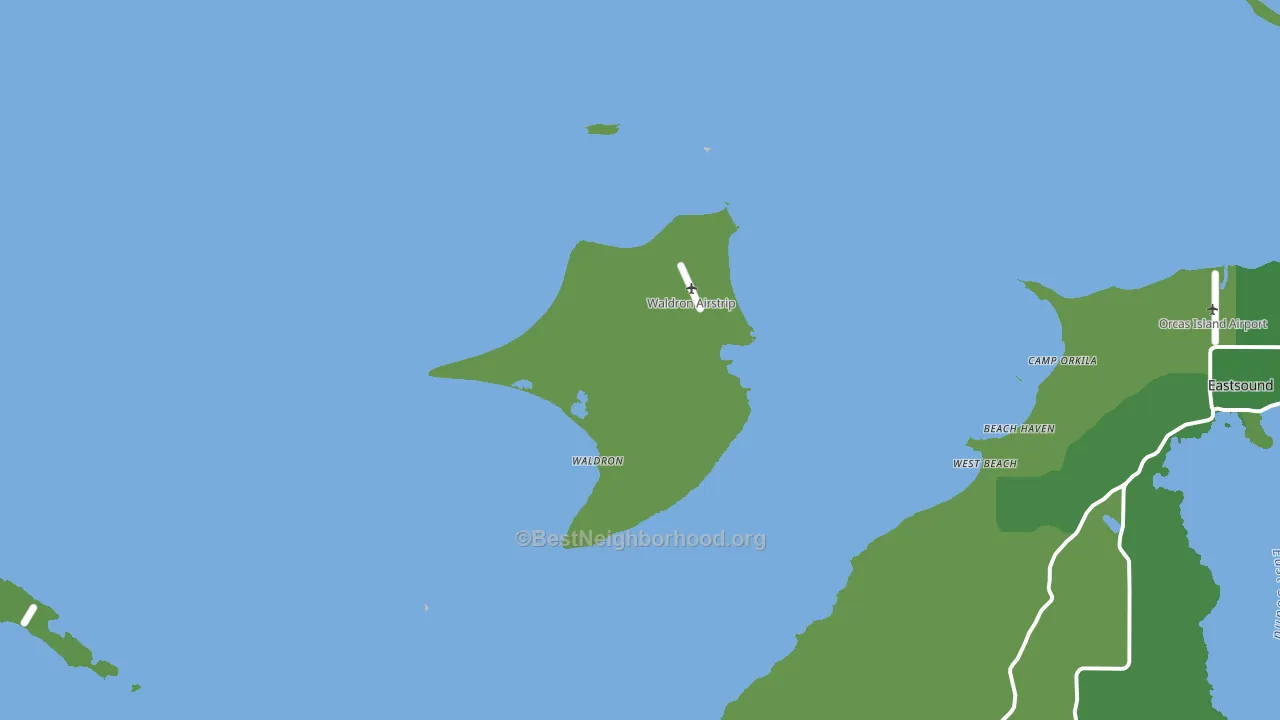
About 77% of adults in Waldron typically vote, above the U.S. average of about 62%. Among adults in Waldron, ~64% vote Democratic, ~13% Republican, and ~23% don't vote. The map below shows estimated turnout by block group.
How Waldron compares
Among cities within 25 miles, Waldron leans more Democratic than 25 of 26 neighbors.
Waldron runs about 48 points more Democratic than Washington as a whole.
Why Waldron leans the way it does
This analysis examined 14,881 data points per city to find what predicts political lean and turnout. The items below are a few correlations that stood out for Waldron, not a ranked or complete list of what matters most.
Areas with high college attainment vote Democratic. About 45% of adults in Waldron hold a bachelor's degree, about 17 points above the U.S. average of 28%.
High-school completion, developed land, and voter turnout
Places that combine high-school-completion-heavy adults and a rural land-use pattern tend to turn out at a higher rate, as Waldron, WA does.
Why turnout in Waldron looks the way it does
Areas with strong routine healthcare access turn out at higher rates. Waldron is in the top quarter nationally for routine-care measures such as insurance coverage, preventive screenings, and dental visits. The dental-visit rate here is about 71%, about 11 points above the U.S. average of 60%. High high-school completion lines up with higher turnout, and about 98% of adults in Waldron have completed high school, above 96% of cities. Learn more about the findings and methodology on the political spectrum map.
Nearby Cities
- West Sound, WA D+64
- Eastsound, WA D+57
- Deer Harbor, WA D+67
- Orcas, WA D+56
- Roche Harbor, WA D+42
- Olga, WA D+58
- Shaw Island, WA D+53
- Friday Harbor, WA D+42
- Blakely Island, WA D+48
- Port Stanley, WA D+47
Cities with Similar Populations
- Dublin, AL R+14
- Lime Kiln, AL R+75
- Litchfield Plains, ME R+33
- Earlehurst, VA R+62
- Pine Grove, VA R+63
- Brogan, OR R+66
- Brumley, TX R+67
- South Haleyville, AL R+77
- Iddo, FL R+76
- Honaunau, HI D+32
Sources and methodology
Precinct-level voting records used to fit the model come from Washington Secretary of State, Elections, distributed by the Voting and Election Science Team. Demographic inputs come from the U.S. Census Bureau (ACS 5-year estimates and the 2020 Decennial Census). Health and environmental inputs come from the CDC (PLACES and the Environmental Justice Index). Land cover comes from the USGS and EPA. Election-day and lead-up weather come from PRISM 4km daily grids and the NOAA Global Historical Climatology Network. Mail-voting and election-administration patterns come from the MIT Election Lab's Survey of the Performance of American Elections. Block-group crime detail comes from CrimeGrade. Internet data and modeling support provided by ISPreports.org.
Modeling and analysis by the BestNeighborhood data science team. Full methodology and findings: political spectrum map.
Methodology reviewed by the BestNeighborhood data team. Last updated May 2026.