West Middleton is a Republican stronghold. About 22% of voters here vote Democratic and 78% Republican.
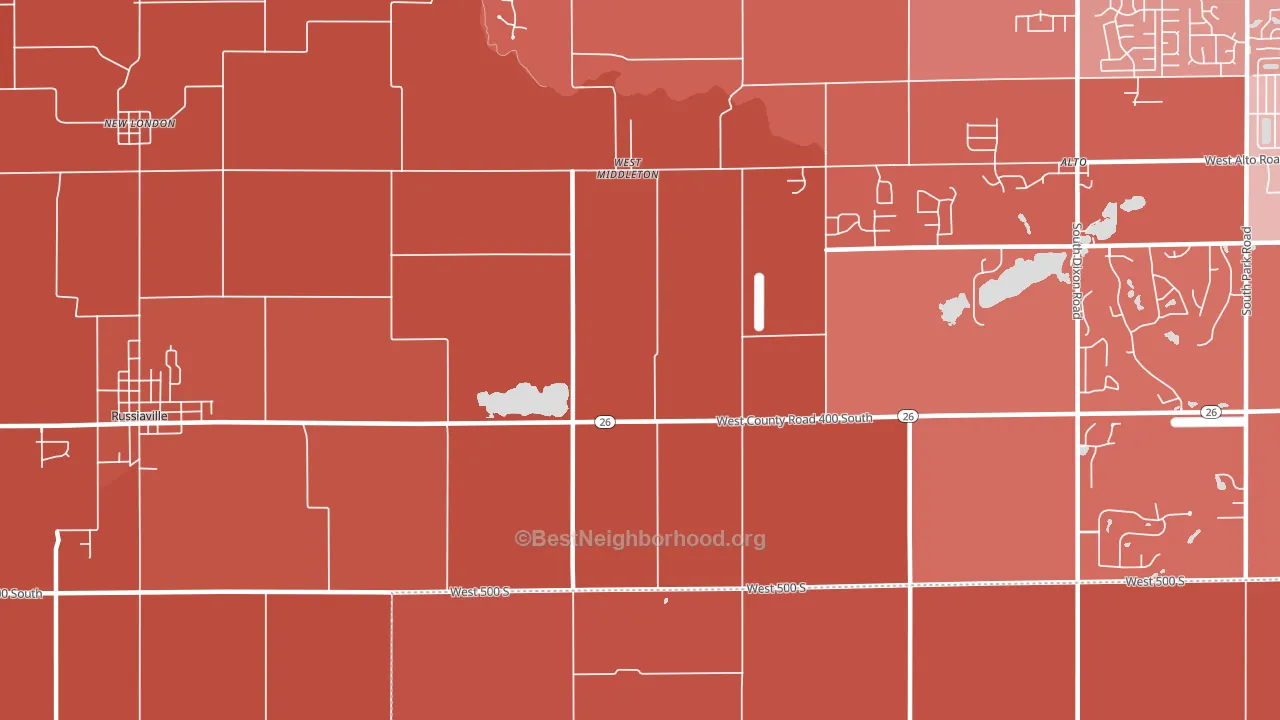
About 84% of adults in West Middleton typically vote, above the U.S. average of about 62%. Among adults in West Middleton, ~19% vote Democratic, ~66% Republican, and ~15% don't vote. The map below shows estimated turnout by block group.
How West Middleton compares
Among cities within 25 miles, West Middleton leans more Republican than 36 of 98 neighbors.
West Middleton runs about 36 points more Republican than Indiana as a whole.
Why West Middleton leans the way it does
Density, race composition, education, and family structure all sit close to their national averages in West Middleton. The lean here lands roughly where demographic data alone would predict.
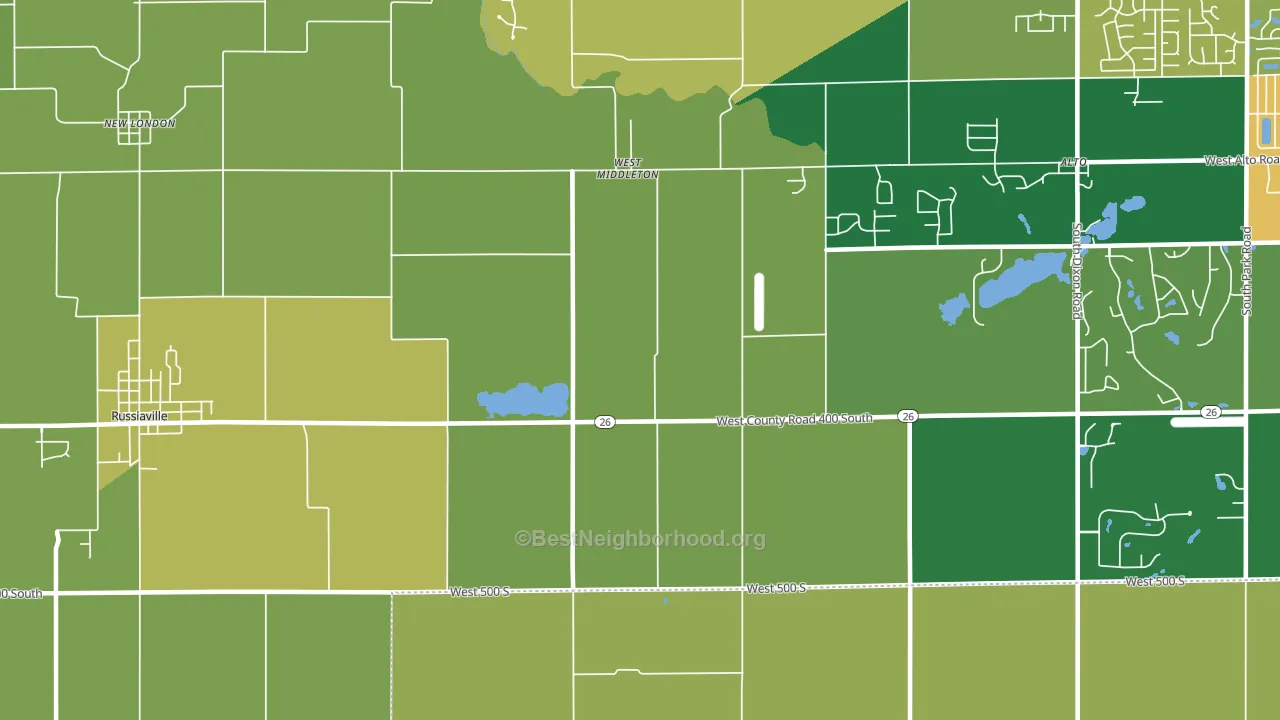
Park access and Republican lean
Places with low park coverage tend to lean Republican; West Middleton, IN sits in the bottom tenth nationally on this measure. Park access does not change how people vote; it tends to track denser, higher-income areas.
Why turnout in West Middleton looks the way it does
Areas with strong routine healthcare access turn out at higher rates. West Middleton is in the top quarter nationally for routine-care measures such as insurance coverage, preventive screenings, and dental visits. The dental-visit rate here is about 68%, about 8 points above the U.S. average of 60%. Homeowners vote more often than renters, and about 96% of households in West Middleton own their home, about 21 points above the U.S. average of 75%. Learn more about the findings and methodology on the political spectrum map.
Nearby Cities
- Russiaville, IN R+54
- Kokomo, IN R+25
- Oakford, IN R+51
- Judson, IN R+59
- Forest, IN R+61
- Normanda, IN R+57
- Sharpsville, IN R+54
- Kempton, IN R+59
- Middlefork, IN R+61
- Hemlock, IN R+53
Cities with Similar Populations
- Beaver Falls, NY R+51
- Alder Creek, NY R+45
- Waterville, IA R+39
- Ellisboro, NC R+59
- Sisco Heights, WA R+20
- Max, ND R+63
- Red Rock, OK R+37
- Oskar, MI R+19
- San Simon, AZ R+54
- Annapolis, MO R+63
Sources and methodology
Precinct-level voting records used to fit the model come from Indiana Secretary of State, Elections, distributed by the Voting and Election Science Team. Demographic inputs come from the U.S. Census Bureau (ACS 5-year estimates and the 2020 Decennial Census). Health and environmental inputs come from the CDC (PLACES and the Environmental Justice Index). Land cover comes from the USGS and EPA. Election-day and lead-up weather come from PRISM 4km daily grids and the NOAA Global Historical Climatology Network. Mail-voting and election-administration patterns come from the MIT Election Lab's Survey of the Performance of American Elections. Block-group crime detail comes from CrimeGrade. Internet data and modeling support provided by ISPreports.org.
Modeling and analysis by the BestNeighborhood data science team. Full methodology and findings: political spectrum map.
Methodology reviewed by the BestNeighborhood data team. Last updated May 2026.