Youngstown leans heavily Republican by roughly 40 points: about 30% of voters vote Democratic and 70% Republican.
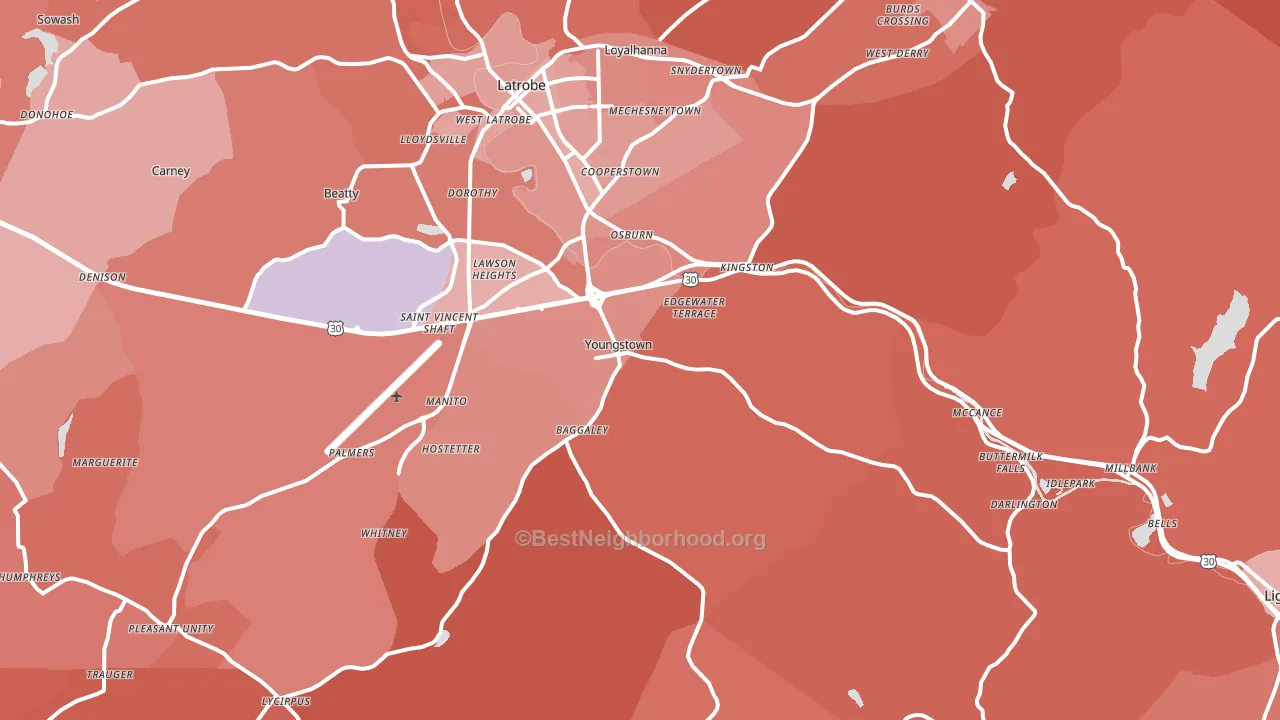
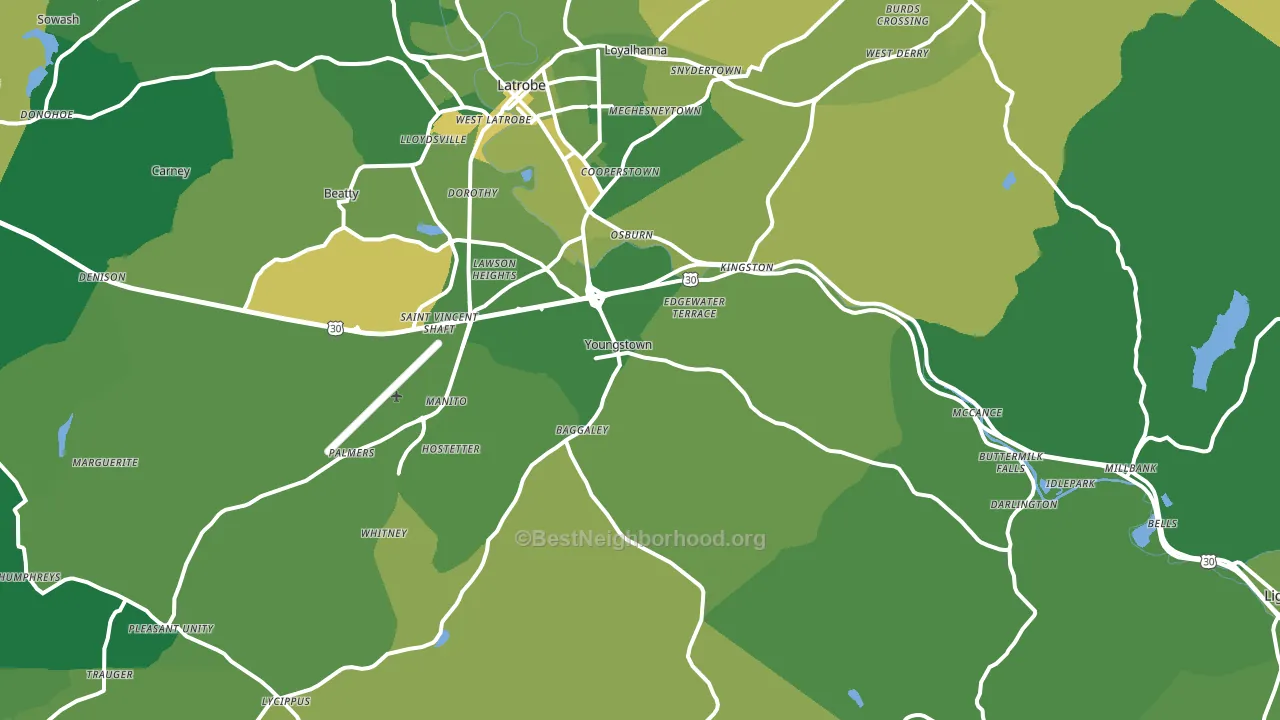
About 82% of adults in Youngstown typically vote, above the U.S. average of about 62%. Among adults in Youngstown, ~25% vote Democratic, ~57% Republican, and ~18% don't vote. The map below shows estimated turnout by block group.
How Youngstown compares
Among cities within 25 miles, Youngstown leans more Republican than 63 of 184 neighbors.
Youngstown runs about 37 points more Republican than Pennsylvania as a whole.
Politics vary noticeably by neighborhood within Youngstown. The northwest side is the most Republican-leaning (R+48) and the east side is the least Republican-leaning (R+36), a spread of about 12 points.
Why Youngstown leans the way it does
This analysis examined 14,881 data points per city to find what predicts political lean and turnout. The items below are a few correlations that stood out for Youngstown, not a ranked or complete list of what matters most.
Youngstown votes Republican even though it is densely developed (about 42%, modestly above the Pennsylvania average of 33%). Here an older population outweighs the Democratic lean that density usually predicts.
Paved land cover and Democratic lean
Places with extensive paved surfaces tend to lean Democratic; Youngstown, PA sits in the top quarter nationally on this measure. Paved ground does not change how people vote; it mostly reflects how urban and built-up a place is.
Why turnout in Youngstown looks the way it does
Areas with high high-school completion turn out at higher rates. About 96% of adults in Youngstown have completed high school, about 6 points above the U.S. average of 90%. Learn more about the findings and methodology on the political spectrum map.
Nearby Cities
- Latrobe, PA R+29
- Hostetter, PA R+36
- St. Vincent College, PA R+14
- McCance, PA R+39
- Loyalhanna, PA R+36
- Whitney, PA R+41
- Bradenville, PA R+42
- Lycippus, PA R+46
- Derry, PA R+39
- Pleasant Unity, PA R+38
Cities with Similar Populations
- Westport, KY R+40
- Pine Grove Mills, PA Even
- Posey Mill, AL R+85
- East Prospect, PA R+44
- Shelby City, KY R+57
- Poseyville, MI R+36
- Berlin, NY R+31
- Waterville, KS R+64
- Marshall, IN R+59
- Mc Daniels, KY R+59
Sources and methodology
Precinct-level voting records used to fit the model come from Pennsylvania Department of State, Bureau of Elections, distributed by the Voting and Election Science Team. Demographic inputs come from the U.S. Census Bureau (ACS 5-year estimates and the 2020 Decennial Census). Health and environmental inputs come from the CDC (PLACES and the Environmental Justice Index). Land cover comes from the USGS and EPA. Election-day and lead-up weather come from PRISM 4km daily grids and the NOAA Global Historical Climatology Network. Mail-voting and election-administration patterns come from the MIT Election Lab's Survey of the Performance of American Elections. Block-group crime detail comes from CrimeGrade. Internet data and modeling support provided by ISPreports.org.
Modeling and analysis by the BestNeighborhood data science team. Full methodology and findings: political spectrum map.
Methodology reviewed by the BestNeighborhood data team. Last updated May 2026.