Fall Branch, TN Demographics

This page shows a collection of maps for Fall Branch (pop: 4,319) of different demographic data.

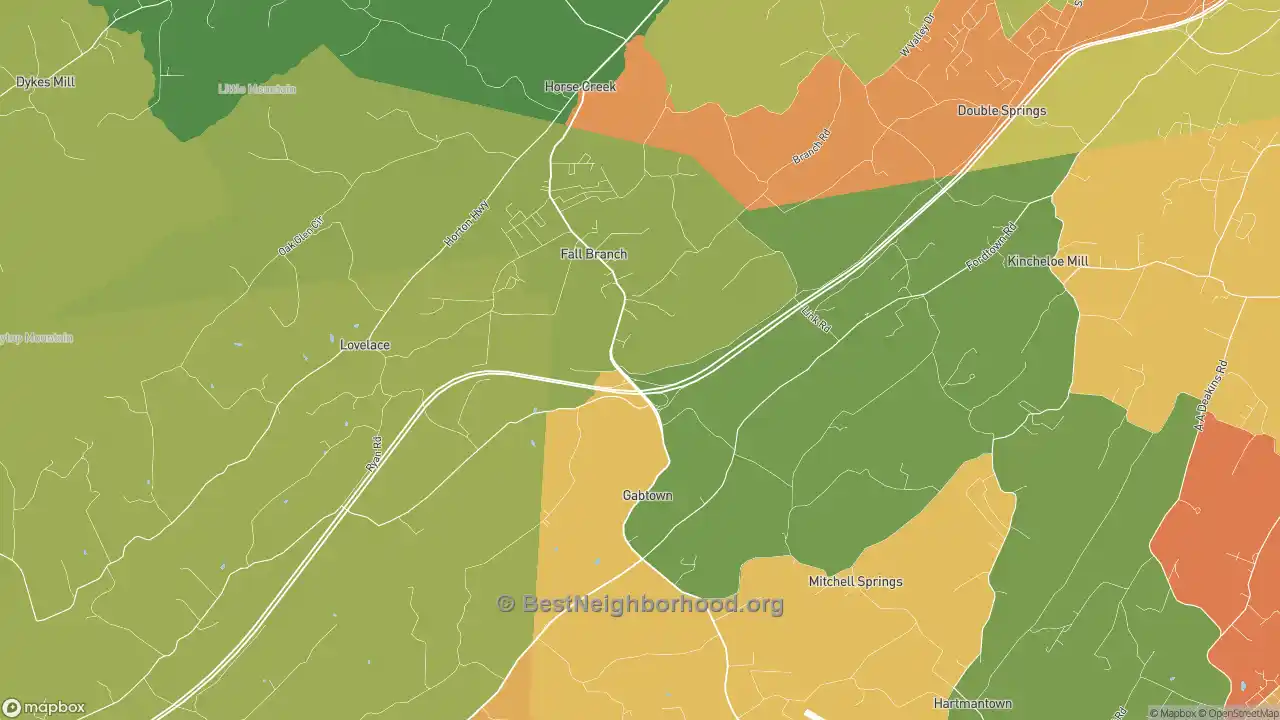
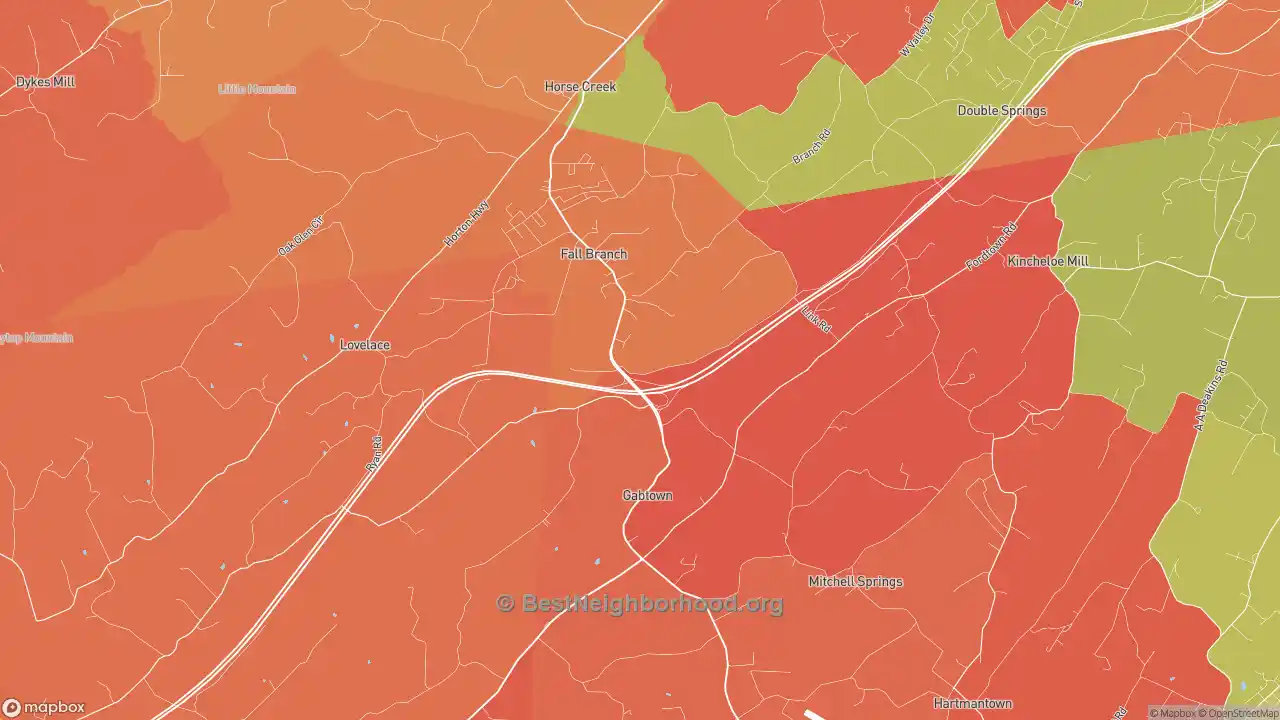
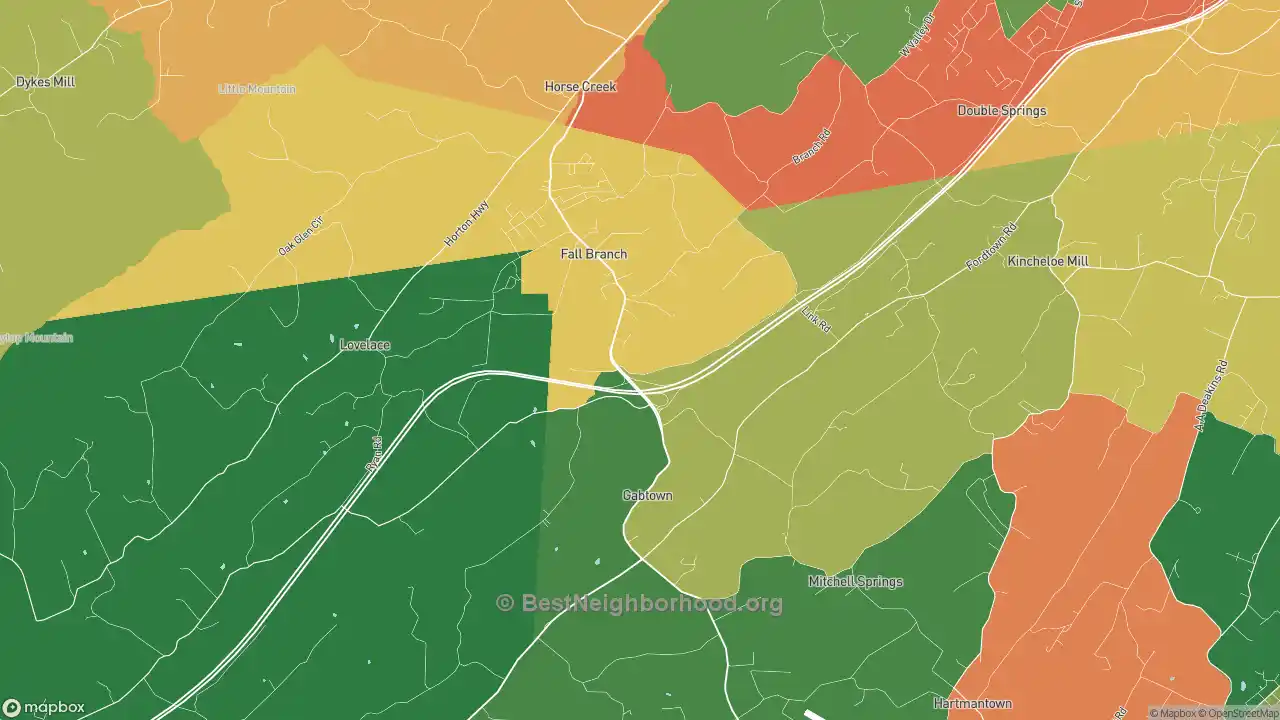
Fall Branch, TN Household Size Map

This map shows household size in Fall Branch by neighborhood or county. Fall Branch has an average of 2.40 individuals per household. Red areas have larger household sizes, which generally means more children. Green areas have smaller household sizes, and there will typically be fewer young children.


Fall Branch, TN Map of Household Size by Area
Click the map to explore

Household Size Key

Smaller Households
Medium Size Households
Larger Households

Fall Branch, TN Resident Age Map

The median age of residents in Fall Branch is 51.78. This is older than the median age of 38.1 in the United States.

The areas in green are among the youngest areas in the city. Areas in red show Fall Branch neighborhoods where the median resident is older, and areas in yellow show areas where the median age is between the late 30s and early 40s.


Fall Branch, TN Map of Household Size by Area
Click the map to explore

Resident Age Key

Young
Middle Age
Older

Fall Branch, TN Single Parent Homes Map

This map shows where single-parent households live. In Fall Branch, 5.26% of households have a single parent. Neighborhoods with very few one-parent households are green, and areas with many single-parent households are red.


Fall Branch, TN Map of Single Parent Households
Click the map to explore

% Single Parent Homes Key

Few Single Parent Homes
Some Single Parent Homes
Many Single Parent Homes

Home Services

No other site shows detail at this level for free. We are able to keep this site free by receiving a small commission from the referring links on this page. Please share or cite this page if you aren't able to otherwise support our work. Note that big changes are coming to this page in particular to add much more detail.

Updated 2023 using the most recent data available (2021)