The map below shows median household income in The Plot by area. High-earning areas are in green, moderate-earning areas are in yellow, and low-earning areas are in red.
The map below shows median household income in The Plot by area. High-earning areas are in green, moderate-earning areas are in yellow, and low-earning areas are in red.
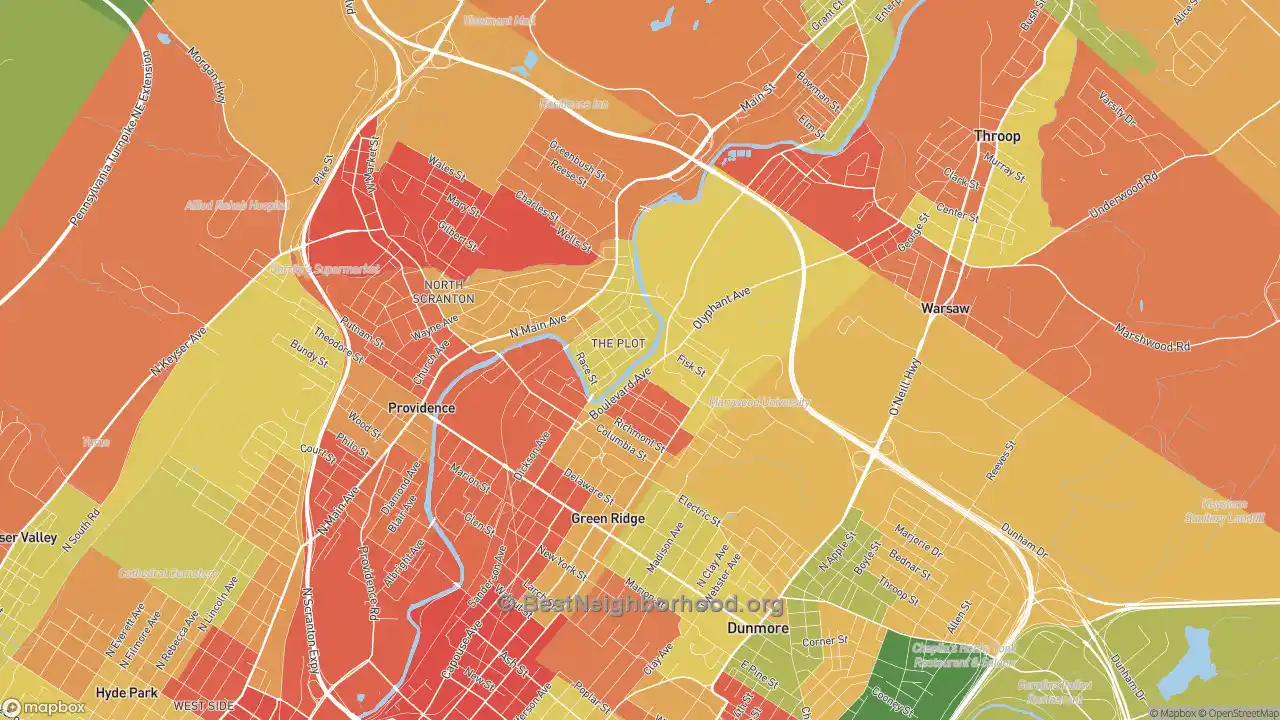
The median household income in The Plot is $57,035. This means The Plot income is lower than the median income in the United States, with neighborhood household incomes in the 38th percentile.
Education is usually most correlated with income, and in The Plot 30% of adults have bachelor’s degrees or higher versus 31% nationwide. 61% of neighborhoods have higher median household incomes, and 37% of neighborhoods have lower median household income. Compared to nearby neighborhoods, family and household incomes are higher. Median income ranges from a low of $36,426 to a high of $68,295 in some neighborhoods.
Higher income areas are typically found in the central parts of the neighborhood, and lower income areas are in the southwest areas.
No other site shows detail at this level for free. We are able to keep this site free by receiving a small commission from the referring links below if you book, rent, or request a lead at no cost to you. Please share or cite this page if you aren’t able to otherwise support our work.
Map interface © Mapbox © OpenStreetMap Map data and content © bestneighborhood