Affordable
Expensive
Expensive
Colorblind friendly
off
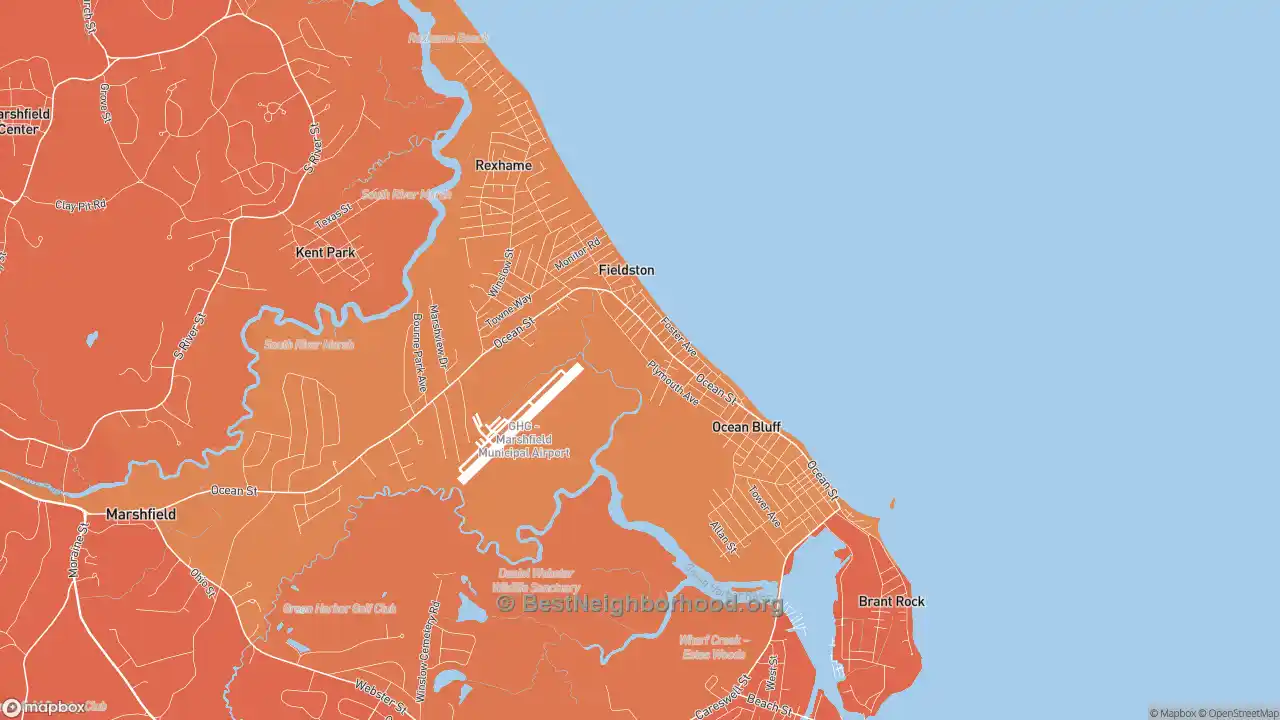
These days, finding an affordable place to live in the Ocean Bluff-Brant Rock area can be challenging. Home prices in Ocean Bluff-Brant Rock are now at a median cost of $395,837, lower than the Massachusetts average of $477,554.
The average cost of rent is $1,326/mo in Ocean Bluff-Brant Rock, primarily driven by the current value of real estate in the Ocean Bluff-Brant Rock area. While nearly 26.37% of residents own their homes outright in Ocean Bluff-Brant Rock, 17.62% rent.
Housing affordability isn’t just about home prices, though. The average household income in Ocean Bluff-Brant Rock is $7,906 per month. Households that rent pay about 16.78% of their income on rent here. Ocean Bluff-Brant Rock’s most expensive areas are in the southeastern regions, while the cheapest areas are in the western parts of the city.
Nearby Cities
- Marshfield, MA: higher priced homes
- Humarock, MA: higher priced homes
- Marshfield Hills, MA: higher priced homes
- Duxbury, MA: higher priced homes
- Rivermoor, MA: higher priced homes
- Standish, MA: higher priced homes
- Pembroke, MA: higher priced homes
- Scituate, MA: higher priced homes
- Silver Lake, MA: equally priced homes
- Kingston, MA: higher priced homes
Cities with Similar Populations
- St. Marys, WV: less expensive homes
- Stigler, OK: less expensive homes
- Stevenson, AL: less expensive homes
- Sterrett, AL: less expensive homes
- Stephenson, VA: less expensive homes
- Staples, MN: less expensive homes
- Stanton, TX: less expensive homes
- Stanton, MI: less expensive homes
- Stanfield, NC: less expensive homes
- Staatsburg, NY: less expensive homes
No other site shows detail at this level for free. We are able to keep this site free by receiving a small commission from the referring links below if you book, rent, or request a lead at no cost to you. Please share or cite this page if you aren’t able to otherwise support our work.
Map interface © Mapbox © OpenStreetMap Map data and content © bestneighborhood