NNTC is a cell provider in the United States serving 2 states, with Colorado and Utah having the most coverage from NNTC. Learn more about NNTC’s cell coverage and availability on this page. The latest NNTC coverage maps for 5G and 4G are also available below.
Can I get NNTC cell service in my area?
The easiest way to find out if you have NNTC coverage near you is to click the link below or enter your zip code.
NNTC covers approximately 3,759 people across the US. You can enter your zip code below to get a better idea of cell coverage to your home address or scroll down to explore NNTC’s current 5G coverage maps:
NNTC Coverage Maps
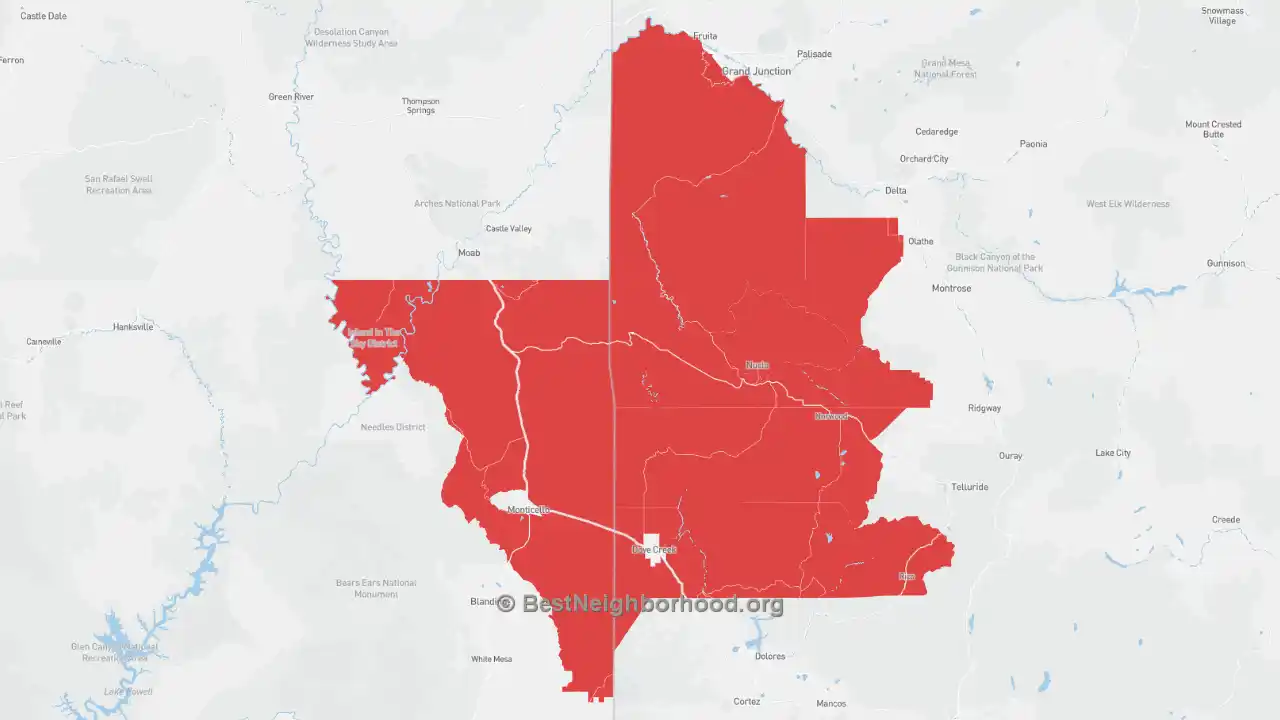
On the maps below you can see NNTC’s coverage area for the United States. Green areas have faster cell service like NNTC 5G. Yellow areas may be covered by 4G only, red areas have slower service, and areas in grey may not have NNTC data service available at all.
Smaller, more regional cellular carriers such as NNTC usually offer their national coverage by making a deal with one or more of the big three major mobile providers: Verizon, AT&T and T-Mobile so be sure to view their coverage maps as well.
NNTC network(s) used: National network unknown
NNTC National Coverage Map

NNTC National Coverage Key
The average home covered by NNTC gets speeds of 38.82 Mbps, which is faster than most cell carriers. NNTC has some combination of 2G, 3G, 4G or 5G cellular technology covering 0.06% of the country’s land area– that’s 1,960 square miles of cell coverage nationally for all the geography nerds out there.
NNTC 5G Coverage Map
NNTC does not currently offer 5G in the US. This may change in the future so check back later as we refresh our data regularly.
NNTC 4G Coverage Map
NNTC does not currently offer 4G in the US. This may change in the future so check back later as we refresh our data regularly.
NNTC 2G & 3G Coverage Map
NNTC 2G& 3G Coverage Key
2G and 3G networks are being technologically phased out in favor of 5G. These older technologies are the fastest technology in 0.00% of NNTC’s coverage area. But NNTC and other cell service providers are still maintaining a network of 2G and 3G towers that currently serve more rural areas and smaller cities. Data speeds are much slower on 2G/3G and you can expect this service to move over to 5G over the next decade. 2G/3G also provide decent coverage for voice calls almost everywhere, even today. We chose to include this NNTC coverage map for folks still relying on that technology for cell service.
Where does NNTC have the best coverage
Still trying to determine whether NNTC has great coverage near you? The table below shows NNTC’s coverage and 5G availability in each state. Click on a state or territory in the US below to view more detailed information about NNTC’s coverage there:
| State | NNTC Overall Coverage | NNTC 5G Coverage | Square Mileage Covered (Any Technology) |
|---|---|---|---|
| Colorado | 97.35% | 0.00% | 90,455.04 miles squared |
| Utah | 2.57% | 0.00% | 12,348.21 miles squared |
What cities and zips does NNTC have the best coverage in?
NNTC has coverage in 13 towns and 13 zip codes. For your convenience, we’ve listed some of the cities and zip codes that NNTC serves best. Click on one of the cities below or enter your own zip code above to get more information about NNTC cell coverage near you:
| City | NNTC Overall Coverage | NNTC 5G Coverage | Square Mileage Covered (Any Technology) |
|---|---|---|---|
| Norwood, CO | 99.75% | 0.00% | 860.30 miles squared |
| Nucla, CO | 100.00% | 0.00% | 1,557.10 miles squared |
| Redvale, CO | 99.06% | 0.00% | 1,587.50 miles squared |
| Naturita, CO | 100.00% | 0.00% | 93.03 miles squared |
| Egnar, CO | 74.70% | 0.00% | 255.45 miles squared |
| Paradox, CO | 87.52% | 0.00% | 133.51 miles squared |
| Slick Rock, CO | 100.00% | 0.00% | 652.84 miles squared |
| Vancorum, CO | 100.00% | 0.00% | 887.48 miles squared |
| Bedrock, CO | 99.97% | 0.00% | 246.36 miles squared |
| Dove Creek, CO | 22.68% | 0.00% | 370.13 miles squared |
| Monticello, UT | 2.57% | 0.00% | 15,268.88 miles squared |
| Dunton, CO | 16.19% | 0.00% | 769.33 miles squared |
| Placerville, CO | 25.67% | 0.00% | 1,266.15 miles squared |
| Zip | NNTC Overall Coverage | NNTC 5G Coverage | Square Mileage Covered (Any Technology) |
|---|---|---|---|
| 81423, CO | 99.82% | 0.00% | 2,102.03 miles squared |
| 81424, CO | 99.92% | 0.00% | 1,252.82 miles squared |
| 81422, CO | 100.00% | 0.00% | 719.62 miles squared |
| 81431, CO | 100.00% | 0.00% | 289.56 miles squared |
| 81325, CO | 95.81% | 0.00% | 2,321.64 miles squared |
| 81429, CO | 99.99% | 0.00% | 407.93 miles squared |
| 81324, CO | 0.16% | 0.00% | 1,559.66 miles squared |
| 81411, CO | 99.97% | 0.00% | 110.91 miles squared |
| 81522, CO | 0.23% | 0.00% | 1,600.78 miles squared |
| 84535, UT | 2.57% | 0.00% | 7,681.80 miles squared |
| 81403, CO | 68.50% | 0.00% | 2,295.16 miles squared |
| 81425, CO | 99.45% | 0.00% | 1,134.62 miles squared |
| 81323, CO | 0.10% | 0.00% | 4,750.57 miles squared |
Again, the best way to find out which carrier covers your area best is to enter your zip code or click the link. You can also view our guides to coverage for T-Mobile, AT&T, and Verizon to help decide between the three major mobile carriers you probably have access to in your area.